The operating business is still growing
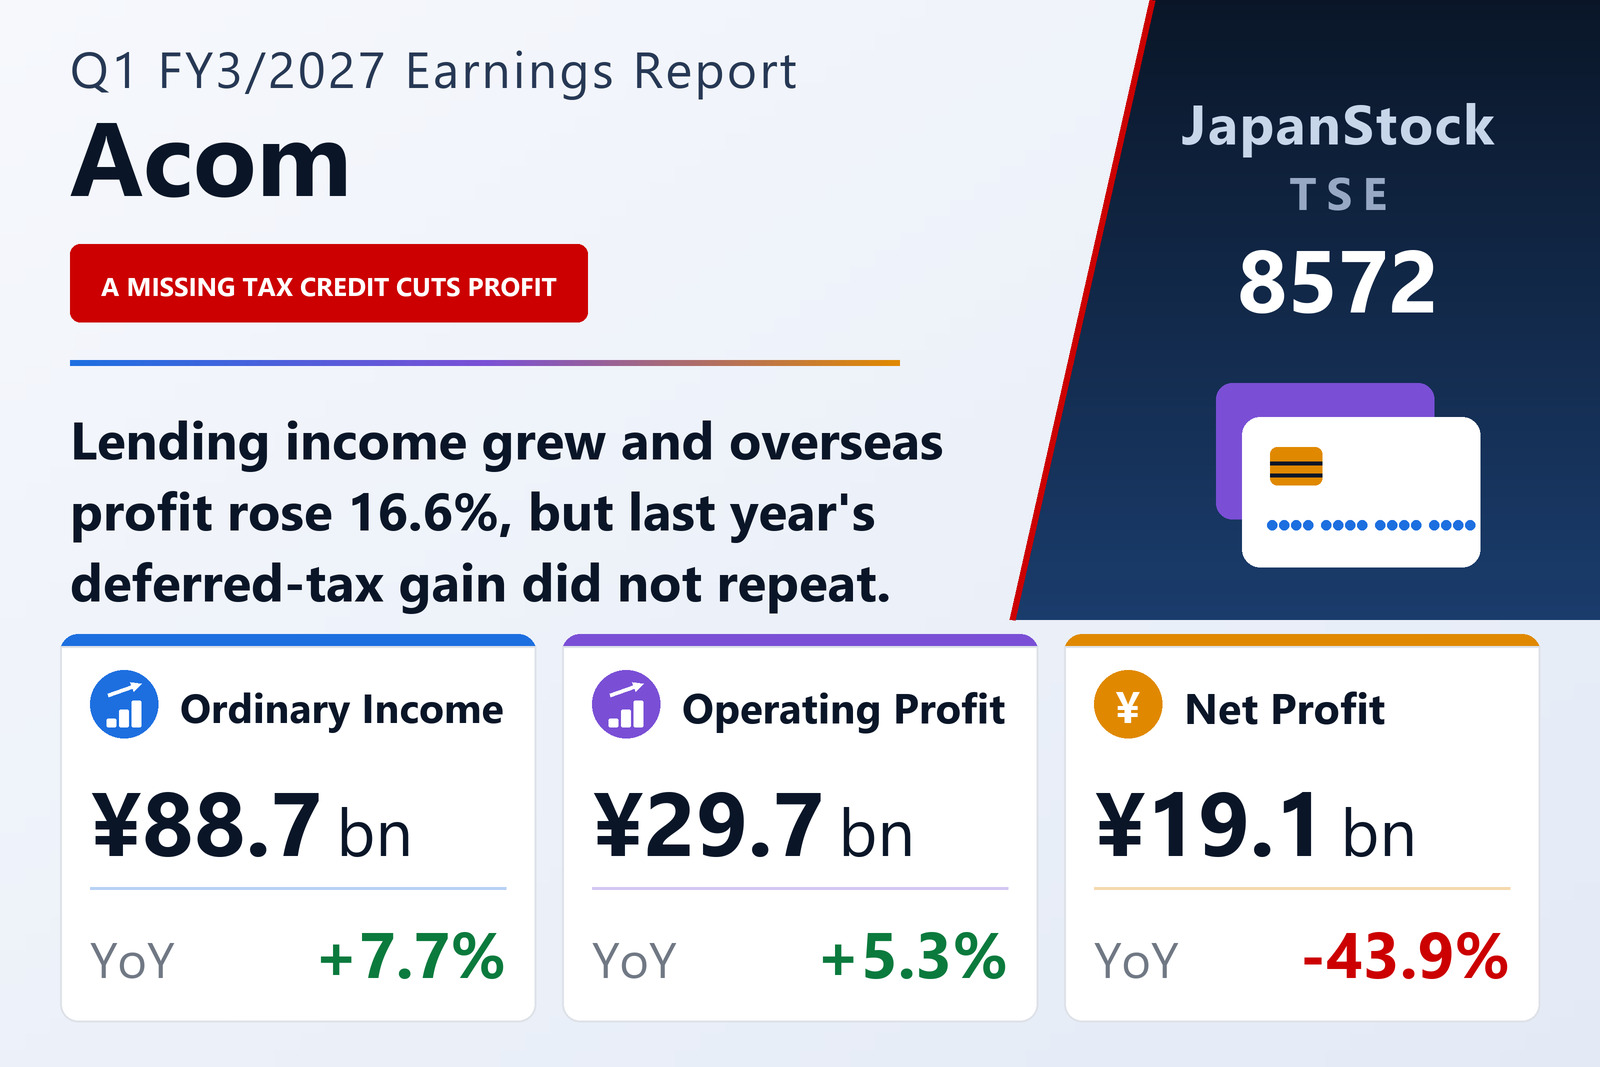
ACOM CO., LTD. (TSE: 8572) published consolidated first-quarter results for FY3/2027 on July 29, 2026, covering April 1 to June 30, 2026 under Japanese GAAP. Operating revenue rose 7.7% to ¥88,731 million, driven chiefly by higher interest on operating loans. Operating expenses rose faster, up 9.0% to ¥59,081 million, on higher funding costs and larger credit-related charges as the loan book expanded. Operating profit still grew 5.3% to ¥29,650 million and ordinary profit 4.9% to ¥29,642 million.
Loans to customers ended June at ¥1,291,516 million, 1.1% above the March level. Management describes domestic funding demand as buoyant on the back of expanding consumer spending, and says interest-repayment claims — the legacy grey-zone liability that has weighed on Japanese consumer lenders for two decades — are declining steadily.
Where the profit came from, and where it did not
The Loan and Credit Card business, the core, lifted revenue 6.6% to ¥47,567 million and segment profit 9.0% to ¥16,469 million, helped by a push to rebuild brand perception and by faster screening and response times. Overseas Financial, spanning Thailand, the Philippines and Malaysia, was the fastest grower with revenue up 10.2% to ¥18,149 million and profit up 16.6% to ¥7,175 million.
Two segments went the other way. Credit Guarantee grew revenue 7.4% to ¥20,878 million but saw profit fall 13.5% to ¥5,513 million. Loan Servicing lifted revenue 15.4% to ¥2,106 million while profit fell 13.2% to ¥433 million. Management flags a caveat on the overseas side: the Philippines remains under a declared national energy emergency, and the Middle East situation, though easing at the margin, still poses a risk to South-East Asian growth.
The tax line explains the headline
Everything above the tax line grew; everything below it shrank. In the first quarter of FY3/2026 Acom recorded a substantial credit in income taxes-deferred after changing its company classification for the assessment of deferred-tax-asset recoverability. With that benefit absent, net profit attributable to shareholders fell 43.9% to ¥19,141 million and earnings per share to ¥12.22 from ¥21.78. Comprehensive income fell 37.3% to ¥15,818 million.
Balance sheet: assets down, equity ratio up
Total assets fell 0.8% to ¥1,603,511 million — a ¥31,563 million drop in cash and deposits and a ¥2,627 million reduction in deferred tax assets outweighing loan growth. Liabilities fell ¥9,197 million, with ¥10,083 million more borrowings and bonds outstanding but ¥15,319 million less accrued income tax.
Net assets slipped 0.5% to ¥778,785 million. Shareholders' equity actually rose ¥341 million — ¥19,141 million of profit against ¥18,799 million of dividends paid — but accumulated other comprehensive income fell ¥3,563 million on foreign-currency translation and non-controlling interests ¥448 million. Because assets fell too, the equity ratio edged up 0.1 points to 44.6%.
Guidance and dividend both held
Acom reaffirmed its full-year FY3/2027 forecast of ¥356,000 million of operating revenue (+5.4%), ¥98,000 million of operating profit (−2.4%), ¥98,500 million of ordinary profit (−2.0%) and ¥63,800 million of net profit attributable to shareholders (−19.9%), for earnings per share of ¥40.72. The half-year plan calls for ¥174,700 million of revenue and ¥37,900 million of net profit. The annual dividend forecast is unchanged at ¥22.00 per share, split ¥11.00 interim and ¥11.00 final against ¥10.00 and ¥12.00 last year.
| Metric | Q1 FY3/2027 | Q1 FY3/2026 | Change |
|---|---|---|---|
| Operating revenue (¥ million) | 88,731 | 82,372 | +7.7% |
| Operating expenses (¥ million) | 59,081 | 54,225 | +9.0% |
| Operating profit (¥ million) | 29,650 | 28,147 | +5.3% |
| Ordinary profit (¥ million) | 29,642 | 28,247 | +4.9% |
| Net profit attrib. to owners of parent (¥ million) | 19,141 | 34,119 | −43.9% |
| Comprehensive income (¥ million) | 15,818 | 25,225 | −37.3% |
| EPS (¥) | 12.22 | 21.78 | −43.9% |
| Loan & Credit Card — revenue (¥ million) | 47,567 | 44,638 | +6.6% |
| Loan & Credit Card — segment profit (¥ million) | 16,469 | 15,106 | +9.0% |
| Credit Guarantee — revenue (¥ million) | 20,878 | 19,446 | +7.4% |
| Credit Guarantee — segment profit (¥ million) | 5,513 | 6,376 | −13.5% |
| Overseas Financial — revenue (¥ million) | 18,149 | 16,462 | +10.2% |
| Overseas Financial — segment profit (¥ million) | 7,175 | 6,152 | +16.6% |
| Loan Servicing — revenue (¥ million) | 2,106 | 1,825 | +15.4% |
| Loan Servicing — segment profit (¥ million) | 433 | 499 | −13.2% |
| Operating loans receivable (¥ million) | 1,291,516 | 1,277,559 | +1.1% |
| Total assets (¥ million) | 1,603,511 | 1,616,379 | −0.8% |
| Net assets (¥ million) | 778,785 | 782,455 | −0.5% |
| Equity ratio | 44.6% | 44.5% | +0.1 pt |
| FY3/2027 guidance — revenue (¥ million) | 356,000 | — | +5.4% |
| FY3/2027 guidance — operating profit (¥ million) | 98,000 | — | −2.4% |
| FY3/2027 guidance — ordinary profit (¥ million) | 98,500 | — | −2.0% |
| FY3/2027 guidance — net profit (¥ million) | 63,800 | — | −19.9% |
| FY3/2027 guidance — EPS (¥) | 40.72 | — | — |
| Annual dividend per share (¥) | 22.00 | 22.00 | unchanged |
JapanStockPulse provides informational content only and does not constitute investment advice. Figures are taken from the company's published earnings short report and may be subject to subsequent revision.