A quarter that always looks bad
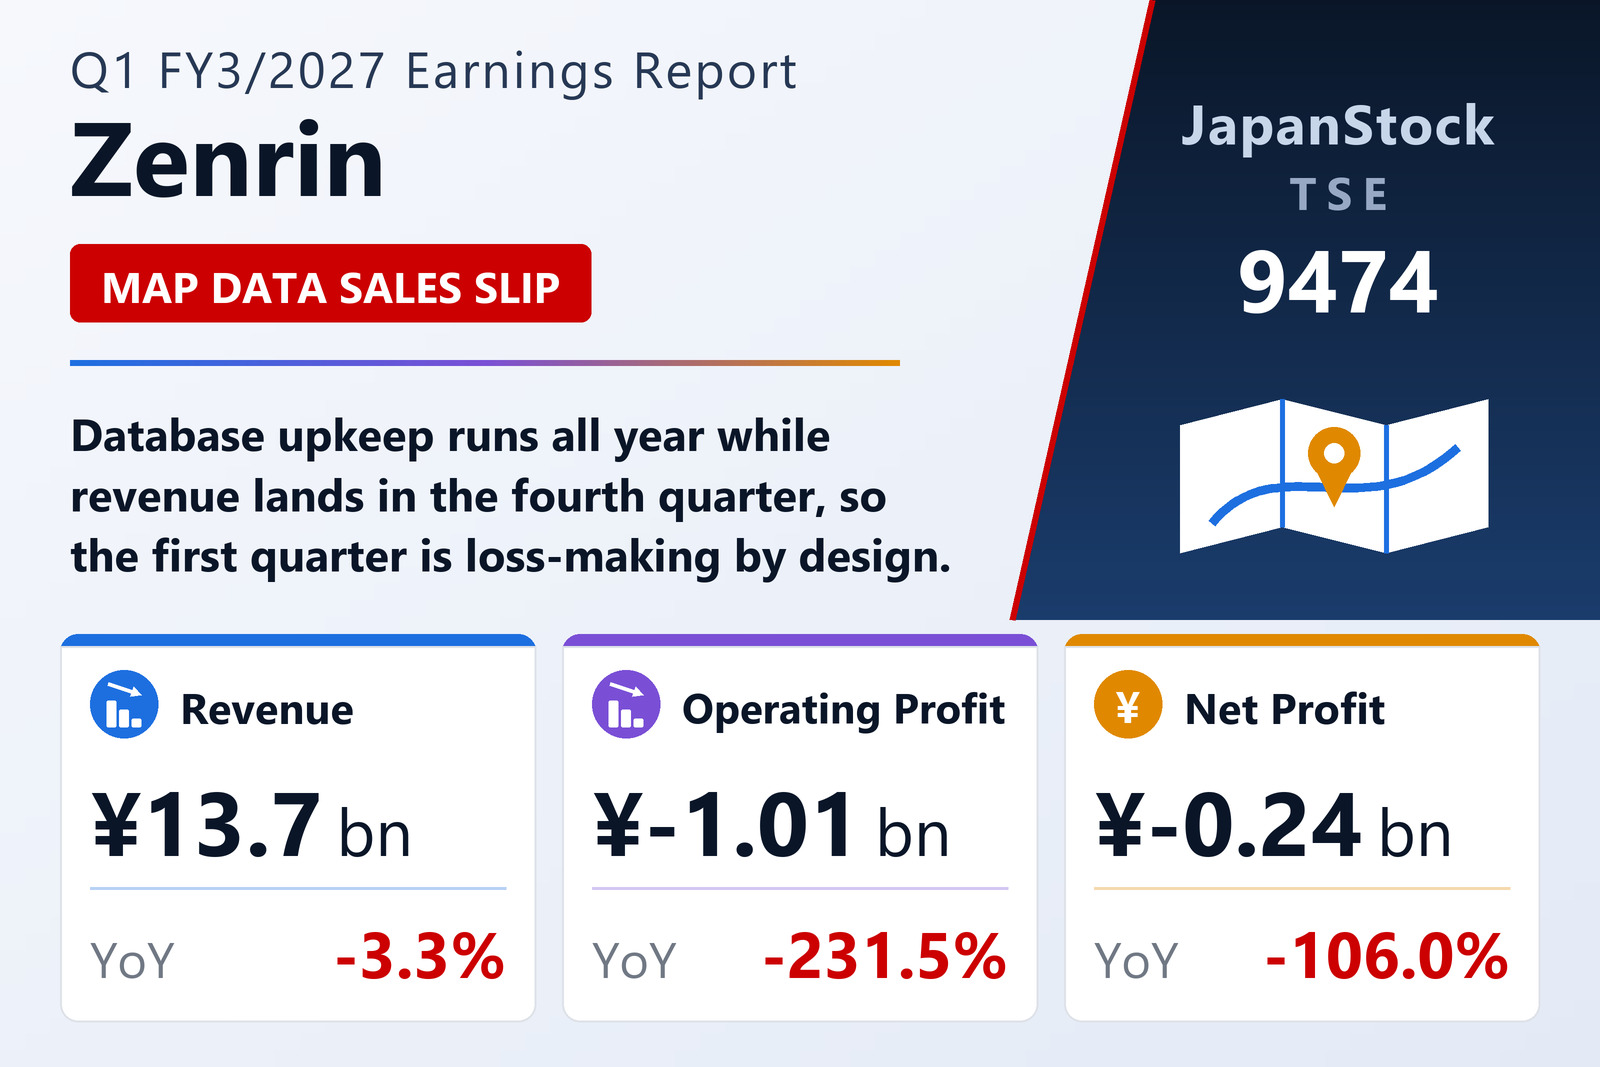
ZENRIN CO., LTD. (TSE: 9474) published consolidated first-quarter results for FY3/2027 on July 29, 2026, covering April 1 to June 30, 2026 under Japanese GAAP. Net sales fell 3.3% to ¥13,726 million, a decline of ¥465 million. The operating loss widened to ¥1,011 million from ¥305 million, the ordinary loss to ¥871 million from ¥58 million, and the net loss attributable to shareholders to ¥241 million from ¥117 million. Loss per share was ¥4.52 against ¥2.21.
Before reading too much into that, note the shape of the business. Zenrin says plainly that the cost of maintaining its map database is incurred evenly through the year while revenue is heavily seasonal and concentrates in the fourth quarter — so the first quarter runs cost-first by construction. The company still guides to a ¥3,600 million full-year operating profit.
Two revenue lines went backwards
The revenue decline has two named causes. In public solutions, the quarter lapped residential map data sales booked a year earlier — a reaction effect rather than a loss of business. In mobility solutions, sales of data for car navigation systems fell.
On the cost side, the loss widened for reasons the company frames as investment: spending to raise the precision of the map database and higher running costs for its service platform. Both are structural bets on a market where high-definition mapping matters for autonomous driving and advanced driver assistance rather than one-off overruns.
Extraordinary gains cushion the bottom line
Net loss narrowed relative to the operating and ordinary lines because of items below them: the company booked a gain on step acquisition and gains on sales of investment securities. The step-acquisition gain relates to Will Smart Inc., newly brought into the consolidation scope this quarter — visible on the balance sheet as non-controlling interests rising to ¥131 million from ¥6 million. Comprehensive income turned positive at ¥232 million against a ¥140 million deficit.
Zenrin reports as a single business segment, so no segment breakdown accompanies these figures.
Balance sheet shrinks, equity ratio rises
Total assets fell 2.4% to ¥70,268 million and net assets 1.6% to ¥48,142 million. Because assets fell faster, the equity ratio improved 0.4 points to 68.3% — a conservatively financed balance sheet by any measure.
Guidance and dividend both held
Zenrin left its full-year FY3/2027 forecast unchanged: net sales of ¥66,000 million (+2.7%), operating profit of ¥3,600 million (+2.8%), ordinary profit of ¥3,900 million (+0.9%) and net profit attributable to shareholders of ¥2,500 million (−8.7%), for earnings per share of ¥46.83. The annual dividend forecast is unchanged at ¥42.00 per share, split ¥21.00 interim and ¥21.00 final.
| Metric | Q1 FY3/2027 | Q1 FY3/2026 | Change |
|---|---|---|---|
| Net sales (¥ million) | 13,726 | 14,191 | −3.3% |
| Operating profit (¥ million) | −1,011 | −305 | loss widened |
| Ordinary profit (¥ million) | −871 | −58 | loss widened |
| Net profit attrib. to owners of parent (¥ million) | −241 | −117 | loss widened |
| Comprehensive income (¥ million) | 232 | −140 | loss to profit |
| EPS (¥) | −4.52 | −2.21 | loss widened |
| Total assets (¥ million) | 70,268 | 72,014 | −2.4% |
| Net assets (¥ million) | 48,142 | 48,903 | −1.6% |
| Shareholders' equity (¥ million) | 48,011 | 48,897 | −1.8% |
| Equity ratio | 68.3% | 67.9% | +0.4 pt |
| FY3/2027 guidance — revenue (¥ million) | 66,000 | — | +2.7% |
| FY3/2027 guidance — operating profit (¥ million) | 3,600 | — | +2.8% |
| FY3/2027 guidance — ordinary profit (¥ million) | 3,900 | — | +0.9% |
| FY3/2027 guidance — net profit (¥ million) | 2,500 | — | −8.7% |
| FY3/2027 guidance — EPS (¥) | 46.83 | — | — |
| Annual dividend per share (¥) | 42.00 | 42.00 | unchanged |
JapanStockPulse provides informational content only and does not constitute investment advice. Figures are taken from the company's published earnings short report and may be subject to subsequent revision.