The yen paid for the top line
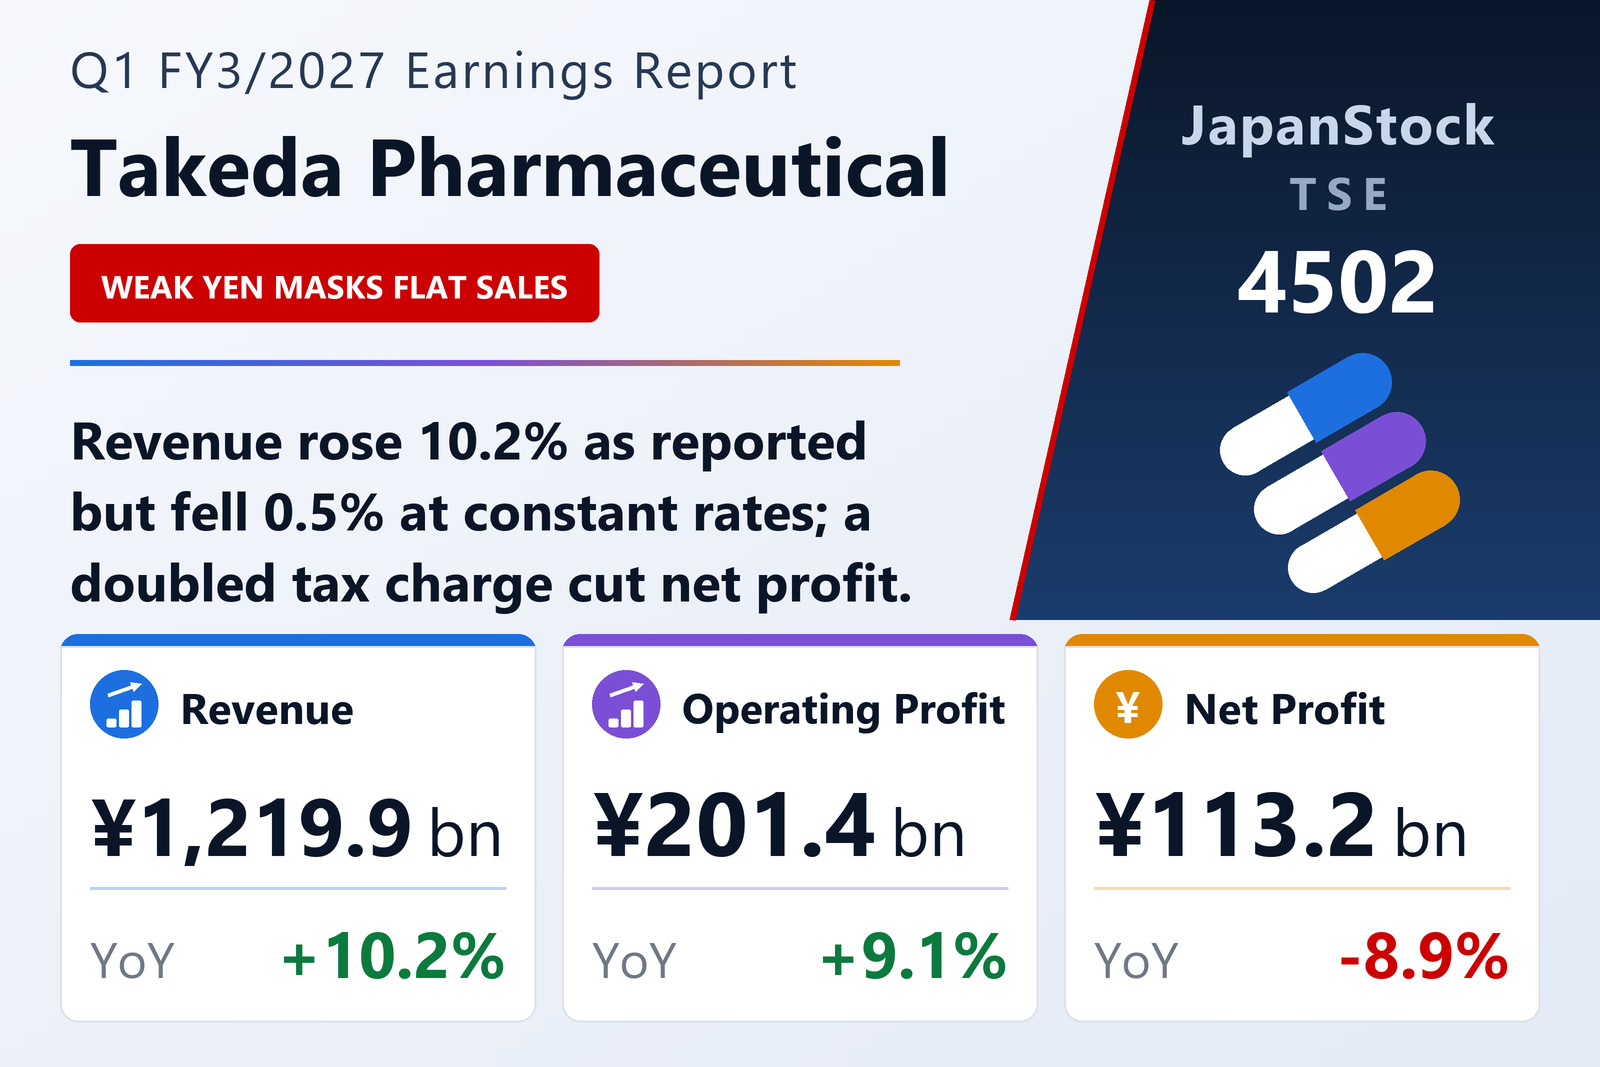
Takeda Pharmaceutical Company Limited (TSE, Nagoya, Sapporo and Fukuoka: 4502) disclosed consolidated first-quarter results for the fiscal year ending March 2027 — April 1 to June 30, 2026 — under IFRS on July 30, 2026. Revenue rose 10.2% to ¥1,219,900 million from ¥1,106,685 million, an increase of ¥113,215 million. At constant exchange rates the same top line fell 0.5%. The entire reported gain, in other words, and a little more besides, came from the weaker yen; the underlying business was flat to marginally smaller.
That gap between the two measures is the single most important fact in the quarter, and Takeda applies it consistently. Its core business areas produced ¥1,169.2 billion of revenue, up 10.8% as reported but up only 0.1% at constant rates. Revenue outside the core areas came to ¥50.7 billion, down 1.1% as reported and 11.8% at constant rates. Stripped of currency, the company describes Core revenue as broadly flat: steady growth from established products and recent launches was offset by products that have passed their period of exclusivity and by mature lines in decline. Established products — those launched more than six years ago with annual sales above ¥100 billion, a list that runs ENTYVIO, GATTEX/REVESTIVE, VOCINTI, TAKHZYRO, immunoglobulins, albumin and ADCETRIS — accounted for 58% of Core revenue and grew 2.3% at constant rates. New products, launched within the past five years, made up 4% of Core revenue and grew 22.6%.
By region the pattern is stark. The United States, Takeda's largest market at ¥568.9 billion, rose 4.1% as reported but fell 5.2% at constant exchange rates — a 9.3-point spread, and the clearest single illustration of what the yen did for the reported figures. Japan, where no currency effect applies, fell 3.8% to ¥103.9 billion (−4.2% at constant rates). Europe grew 19.1% as reported to ¥282.1 billion but 4.9% at constant rates; Latin America 28.9% versus 10.1%; China 21.0% versus 4.3%; Asia excluding Japan and China 15.4% versus 7.6%; Russia and the CIS 22.2% versus 5.3%; and other regions 22.9% versus 8.5%. Every region outside Japan carries a double-digit gap between the two bases. Note that the segment previously reported as "Europe and Canada" is now simply "Europe", with Canadian revenue moved into "Other"; prior-year figures have been restated on the new basis.
Costs climbed, and only amortisation pulled the other way
Below revenue, three of the four large cost lines grew faster than the business did. Cost of sales rose 5.7% to ¥406.7 billion — slower than revenue, and down 4.5% at constant rates, helped by an improved product mix that lowered the cost ratio. Selling, general and administrative expenses rose 12.0% to ¥286.5 billion, faster than reported revenue, though only 1.6% at constant rates. Research and development rose 16.3% to ¥167.4 billion, the fastest-growing line on the income statement and up 6.8% even at constant rates, reflecting increased spending on the late-stage pipeline including elritercept, TAK-928 and TAK-921. That is a genuine, currency-independent step up in investment, and it lands in a year management has already told investors will see Core operating profit fall.
Amortisation and impairment of product intangibles was the one line moving in Takeda's favour, falling 15.7% to ¥110.9 billion (−23.3% at constant rates). Amortisation itself dropped ¥23.8 billion, mainly because the intangible asset associated with VYVANSE/ELVANSE has finished amortising; impairment rose ¥3.1 billion on the decision to discontinue a celiac disease development programme.
The two "other" lines both worked against the quarter. Other operating income fell 62.5% to ¥8.3 billion: this quarter carried a ¥6.2 billion gain on the completed divestment of RIOPAN, a non-core gastric acid suppressant sold mainly in Europe, against ¥17.9 billion of divestment gains a year earlier from non-core products and MEPACT in Europe, the Middle East and North Africa. Other operating expenses almost doubled, rising 96.8% to ¥55.2 billion, as business restructuring costs increased ¥35.8 billion under the company's transformation programme, partly offset by lower pre-approval inventory costs than the prior year carried. Netting all of it, operating profit rose 9.1% to ¥201,417 million — but fell 3.1% at constant exchange rates. Core operating profit, Takeda's preferred internal measure, came in at ¥358.9 billion, up 11.5% as reported and down 0.5% at constant rates.
Tax, not trading, is why net profit fell
Net finance costs widened to a ¥39.2 billion loss from ¥33.4 billion, up 17.5%, mainly on interest on the US dollar-denominated guaranteed senior unsecured notes issued on July 2, 2025. Share of profit of investments accounted for using the equity method was a ¥538 million profit against a ¥536 million loss a year earlier. Profit before tax therefore rose 8.0% to ¥162,718 million, though it fell 6.8% at constant rates.
Then comes the line that decides the quarter. Income tax expense rose 87.7% to ¥49,462 million from ¥26,351 million — an increase of ¥23,111 million, nearly twice the ¥12,088 million the pre-tax line gained. Takeda attributes the jump to a reassessment of the recoverability of deferred tax assets, a reduction in tax credits, and additional tax under the United States' international tax rules. The effective rate implied by those figures moves from roughly 17.5% to about 30.4%.
The result is a profit line that moves opposite to the operating line above it. Profit for the period fell 8.9% to ¥113,256 million, and profit attributable to owners of the parent fell 8.9% to ¥113,197 million — down 23.5% at constant rates. Basic earnings per share came in at ¥71.65 against ¥79.40 and diluted EPS at ¥70.54 against ¥78.23, both down about 9.8%; the per-share decline runs steeper than the profit decline because the weighted average share count rose to 1,579,922,304 from 1,564,729,658. Core profit for the period was ¥242.9 billion, up 2.5% as reported but down 10.9% at constant rates, and Core EPS was ¥154 against ¥151, up 1.5% as reported and down 11.8% at constant rates.
Comprehensive income tells the currency story from the other end: it more than doubled, rising 127.8% to ¥271,301 million from ¥119,101 million, on ¥163.3 billion of foreign-currency translation gains on overseas operations. The same yen weakness that inflated reported revenue also revalued Takeda's very large overseas asset base, and that shows up here rather than in profit.
Gastroenterology and oncology carry the portfolio; rare disease and plasma retreat
Gastroenterology, the largest business area, produced revenue of ¥386.1 billion, up 13.8% as reported and 3.1% at constant rates — one of only three areas growing on the harder measure. ENTYVIO, the ulcerative colitis and Crohn's disease therapy, contributed ¥268.3 billion, up 15.4% as reported and 3.8% at constant rates. Its US sales of ¥169.5 billion rose 8.4% on the weaker yen against the dollar and on growth in the subcutaneous formulation, while European sales of ¥63.5 billion rose 21.2% on the euro rate and continued patient additions to the subcutaneous presentation. GATTEX/REVESTIVE, for short bowel syndrome, added ¥41.4 billion, up 19.0% as reported and 8.4% at constant rates on firm US demand.
Oncology was the strongest area on the constant-rate measure, at ¥165.6 billion, up 19.4% as reported and 8.2% at constant rates. ADCETRIS reached ¥48.5 billion, up 30.3% and 14.4% at constant rates on solid Latin American demand and the euro; FRUZAQLA ¥17.1 billion, up 38.9% and 26.8%, as it establishes itself as a treatment option in metastatic colorectal cancer in Europe; LEUPLIN/ENANTONE ¥31.7 billion, up 15.8% and 8.0%; and NINLARO ¥24.0 billion, up 14.9% but only 2.6% at constant rates. Vaccines, the smallest area at ¥14.0 billion, grew fastest in percentage terms — up 21.8% and 10.1% at constant rates — on QDENGA, the dengue vaccine, at ¥11.5 billion (+30.5% / +15.2%) as Latin American sales built after launch.
Rare Diseases shows the reverse pattern: ¥206.0 billion, up 4.9% as reported but down 5.8% at constant rates. TAKHZYRO, for hereditary angioedema, was ¥59.9 billion, up 8.7% on currency but down 2.2% at constant rates as US competition intensified; ADVATE, for haemophilia A, fell outright, to ¥25.8 billion, down 7.7% as reported and 17.8% at constant rates, on US competition. Against that, LIVTENCITY reached ¥14.1 billion (+33.7% / +20.8%) on continued US penetration, VONVENDI ¥7.6 billion (+37.6% / +24.2%) helped by a label expansion into prophylaxis in adults, and ADZYNMA ¥4.1 billion (+69.4% / +52.2%) on steady European uptake since launch — real growth, but from bases far too small to offset the larger declining products.
Plasma-Derived Therapies came to ¥283.9 billion, up 8.8% as reported and down 2.1% at constant rates. Immunoglobulins totalled ¥213.9 billion, up 10.2% but down 0.6% at constant rates, with the subcutaneous products CUVITRU and HYQVIA growing at double-digit rates on firm global demand and increased supply, while intravenous GAMMAGARD LIQUID/KIOVIG rose only slightly and mainly on currency. Albumin products were ¥34.6 billion, up 7.5% but down 5.0% at constant rates as US sales fell. Neuroscience was ¥113.6 billion, up 4.6% and down 4.8% at constant rates, the two halves of a split portfolio: TRINTELLIX rose 31.6% (+21.2% at constant rates) to ¥37.0 billion, flattered by a distribution-model change at a major US customer that had depressed the prior-year base, while VYVANSE/ELVANSE fell 6.5% as reported and 17.0% at constant rates to ¥54.1 billion on continued US generic penetration. The non-core "Other" area was ¥50.7 billion, down 1.1% and 11.8% at constant rates.
Balance sheet, cash flow and a guidance that gets harder from here
Total assets stood at ¥15,663,271 million at June 30, 2026, up ¥151.8 billion from ¥15,511,506 million at the year-end. Trade and other receivables rose ¥86.1 billion on higher sales, the timing of cash collection and translation; goodwill rose ¥77.9 billion, essentially all translation; and inventories rose ¥50.6 billion on work in progress for plasma-derived therapies and ENTYVIO plus translation. Those increases were partly offset by a ¥134.1 billion fall in cash and cash equivalents. Total liabilities were ¥8,104,394 million, up ¥23.5 billion; bonds and loans totalled ¥4,940.0 billion — ¥4,715.0 billion of bonds and ¥225.0 billion of loans — up ¥58.1 billion, again mainly on translation.
Total equity rose ¥128.2 billion to ¥7,558,876 million, with equity attributable to owners of the parent at ¥7,557,887 million. Other components of equity added ¥166.7 billion on the translation reserve, partly offset by a ¥45.4 billion fall in retained earnings: the quarter's ¥113.2 billion of profit was more than consumed by ¥158.2 billion of dividend payments. The equity ratio improved to 48.3% from 47.9% and book value per share to ¥4,782.57 from ¥4,702.66.
Cash generation was the quarter's other soft spot. Operating cash flow fell to ¥127.6 billion from ¥215.4 billion, a decline of ¥87.8 billion driven by working-capital movement as receivables built, partly offset by lower income tax payments. Investing cash flow was an outflow of ¥87.7 billion against ¥33.2 billion, on higher spending to acquire intangible assets and lower proceeds from divested businesses net of cash disposed. Financing cash flow was an outflow of ¥180.3 billion against ¥214.9 billion, improving mainly because share buybacks fell. Cash and cash equivalents ended the quarter at ¥461.0 billion against ¥595.1 billion at the start.
Takeda left its FY3/2027 guidance exactly as issued on May 13, 2026. On an actual-rate basis it expects full-year revenue of ¥4,640,000 million, up 3.0% on FY3/2026's ¥4,505.7 billion, operating profit of ¥420,000 million, profit before tax of ¥252,000 million and profit attributable to owners of the parent of ¥166,000 million for basic EPS of ¥104.26 — all three profit lines swinging up from a year in which an antitrust jury verdict on AMITIZA drove a ¥152.4 billion net loss, so no percentage change is given. Core revenue is also guided to ¥4,640,000 million, with Core operating profit of ¥1,160,000 million, down 1.1%, and Core EPS of ¥472 against ¥517. The forecast assumes ¥156 to the dollar and ¥182 to the euro, against ¥150 and ¥174 realised last year.
Management guidance, which Takeda states on a constant-exchange-rate basis and which is also unchanged from May 13, calls for a low-single-digit percentage decline in Core revenue, a 5% to 8% decline in Core operating profit and a mid-teens percentage decline in Core EPS for the full year. Set that against a first quarter in which Core operating profit was only 0.5% lower at constant rates and Core EPS 11.8% lower, and the implication is plain: the constant-currency pressure Takeda expects has barely begun to show in the operating line, and the remaining nine months are guided to carry almost all of it. The dividend forecast is unchanged at ¥204 per share — ¥102 interim and ¥102 year-end, against ¥100 and ¥100 for a ¥200 total in FY3/2026 — a 2% increase held steady even as the guided Core numbers fall. There were no material subsequent events, and the quarterly consolidated financial statements were not reviewed by a certified public accountant or audit firm.
| Metric | Q1 FY3/2027 | Q1 FY3/2026 | Change |
|---|---|---|---|
| Revenue (¥ million) | 1,219,900 | 1,106,685 | +10.2% |
| Revenue, constant exchange rates | — | — | −0.5% |
| Cost of sales (¥ million) | 406,676 | 384,675 | +5.7% |
| SG&A expenses (¥ million) | 286,513 | 255,885 | +12.0% |
| R&D expenses (¥ million) | 167,395 | 143,891 | +16.3% |
| Amortisation & impairment of product intangibles (¥ million) | 110,928 | 131,638 | −15.7% |
| Other operating expenses (¥ million) | 55,229 | 28,061 | +96.8% |
| Operating profit (¥ million) | 201,417 | 184,566 | +9.1% |
| Operating profit, constant exchange rates | — | — | −3.1% |
| Profit before tax (¥ million) | 162,718 | 150,630 | +8.0% |
| Income tax expense (¥ million) | 49,462 | 26,351 | +87.7% |
| Profit for the period (¥ million) | 113,256 | 124,279 | −8.9% |
| Profit attrib. to owners of the parent (¥ million) | 113,197 | 124,243 | −8.9% |
| Basic EPS (¥) | 71.65 | 79.40 | −9.8% |
| Diluted EPS (¥) | 70.54 | 78.23 | −9.8% |
| Core operating profit (¥ million) | 358,900 | 321,800 | +11.5% |
| Core EPS (¥) | 154 | 151 | +1.5% |
| Comprehensive income (¥ million) | 271,301 | 119,101 | +127.8% |
| Total assets (¥ million; vs Mar 31, 2026) | 15,663,271 | 15,511,506 | +1.0% |
| Equity attrib. to owners (¥ million; vs Mar 31, 2026) | 7,557,887 | 7,429,441 | +1.7% |
| Equity ratio (vs Mar 31, 2026) | 48.3% | 47.9% | +0.4 pt |
| Book value per share (¥; vs Mar 31, 2026) | 4,782.57 | 4,702.66 | +1.7% |
JapanStockPulse provides informational content only and does not constitute investment advice. Figures are taken from the company's published earnings short report and may be subject to subsequent revision.