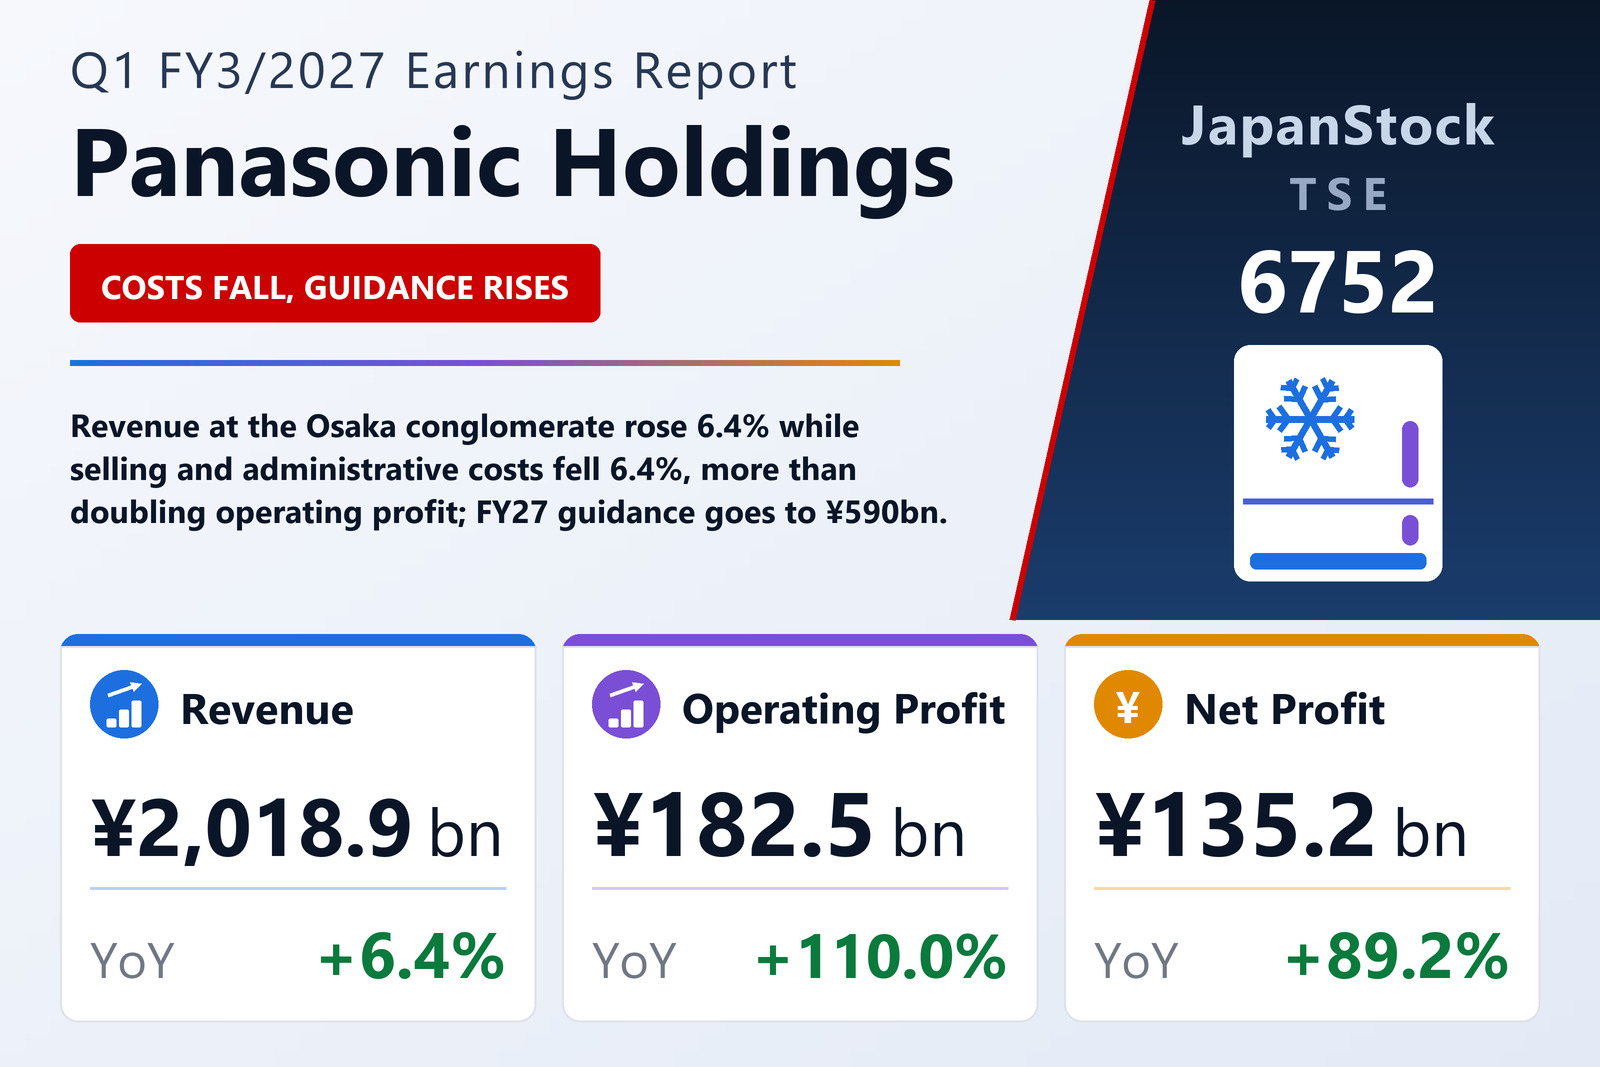
Panasonic Holdings Corporation (TSE: 6752), the Kadoma, Osaka-based electronics and industrial conglomerate, reported consolidated results for the first quarter of the fiscal year ending March 2027 — the three months from April 1 to June 30, 2026 — under IFRS. Revenue rose 6.4% to ¥2,018.9 billion, operating profit rose 110.0% to ¥182.5 billion, profit before tax rose 107.7% to ¥188.9 billion, quarterly net profit rose 81.0% to ¥139.5 billion and profit attributable to owners of the parent rose 89.2% to ¥135.2 billion. Basic earnings per share were ¥57.90 against ¥30.61 a year earlier, with a diluted figure of ¥57.88. The company published no written management commentary in the earnings release itself, directing readers instead to the presentation slides posted on its website the same day, and held briefings for media and for securities analysts and institutional investors on July 30.
Cost discipline, not sales growth, drove the profit surge
The 6.4% revenue increase is a modest number next to a doubling of operating profit, and the arithmetic explains why. Gross profit rose 10.3% to ¥665.9 billion, lifting the gross margin to 33.0% from 31.8%, as cost of sales grew only 4.6% to ¥1,353.0 billion — slower than the top line. The larger swing came below that: selling, general and administrative expenses fell 6.4% to ¥479.5 billion from ¥512.3 billion, a ¥32.8 billion reduction that arrived in the same quarter as a ¥62.1 billion gain in gross profit. Between them the two items account for essentially the entire ¥95.6 billion increase in operating profit, with a wider ¥3.1 billion equity-method loss (against ¥0.9 billion) and a smaller ¥0.9 billion net other expense (against ¥3.7 billion) roughly cancelling out. The operating margin reached 9.0%, against 4.6%, and the comparison is flattered by a weak base: revenue in the year-earlier quarter had fallen 10.6%.
A heavier tax charge trimmed the gain at the bottom line
Net finance income improved to ¥6.5 billion from ¥4.1 billion — finance income was broadly flat at ¥12.8 billion while finance costs fell to ¥6.3 billion from ¥8.6 billion — carrying pre-tax profit growth to 107.7%, almost exactly tracking the operating line. The step down from there is the tax charge: income tax expense jumped to ¥49.5 billion from ¥13.9 billion, an effective rate of 26.2% against 15.3%, which is why net profit rose 81.0% rather than in line with pre-tax profit. Non-controlling interests took ¥4.3 billion, down from ¥5.6 billion, so profit attributable to owners of the parent grew faster than the group total, at 89.2%. Against the newly raised full-year plan, the quarter delivered 25.9% of forecast revenue, 30.9% of forecast operating profit and 30.0% of forecast profit attributable to owners — a front-loaded start on the profit lines.
Guidance raised across the board, with adjusted operating profit up ¥50 billion
Panasonic revised upward every profit line of the full-year forecast it had published on May 12. Revenue guidance rises to ¥7,800.0 billion from ¥7,600.0 billion (+2.6%), operating profit to ¥590.0 billion from ¥550.0 billion (+7.3%), profit before tax to ¥590.0 billion from ¥550.0 billion (+7.3%) and profit attributable to owners of the parent to ¥450.0 billion from ¥420.0 billion (+7.1%), taking forecast EPS to ¥192.73 from ¥179.89. Adjusted operating profit — revenue less cost of sales and SG&A — was lifted to ¥650.0 billion from ¥600.0 billion, an 8.3% increase and the largest proportional revision in the table. Measured against the year just ended, the revised plan implies operating profit growth of 149.6% from ¥236.4 billion, pre-tax growth of 124.2% from ¥263.1 billion and a 137.4% increase in profit attributable to owners from ¥189.5 billion. Revenue, however, is still guided 3.1% lower than the ¥8,048.7 billion recorded in the year to March 2026 — so the company expects the rest of the year to give back the first quarter's top-line growth, while margins carry the earnings recovery.
A weaker yen added ¥102 billion to equity
Total assets stood at ¥10,427.7 billion at June 30, up 2.5% from ¥10,172.4 billion at the March year-end. Cash and cash equivalents rose to ¥903.1 billion from ¥770.2 billion, inventories to ¥1,179.8 billion from ¥1,066.1 billion and trade receivables to ¥1,409.2 billion from ¥1,379.8 billion, lifting current assets to ¥4,226.1 billion; non-current assets edged down to ¥6,201.6 billion, mainly on a ¥151.6 billion decline in other non-current assets. Total liabilities rose only 1.3% to ¥4,853.0 billion, with short-term borrowings and current portions of long-term debt cut to ¥139.3 billion from ¥185.8 billion. Equity attributable to owners of the parent climbed 3.7% to ¥5,405.9 billion, and the ratio of that equity to total assets improved to 51.8% from 51.2%. The single largest contributor after retained earnings was currency: the foreign-currency translation reserve rose ¥102.3 billion to ¥1,351.8 billion, which is why total comprehensive income reached ¥250.0 billion against a ¥31.5 billion loss a year earlier, when translation differences had subtracted ¥112.0 billion. Dividends of ¥46.7 billion were paid to parent shareholders during the quarter.
Annual dividend held at a planned ¥54.00, up 35%
The dividend forecast was left unchanged from the company's previous announcement: an interim of ¥27.00 and a year-end of ¥27.00, for an annual ¥54.00 against the ¥40.00 paid for the year ended March 2026 — a 35% increase, split evenly between the two payments where the prior year paid ¥20.00 twice. Shares issued including treasury stock stood at 2,454,657,997 at the quarter-end, marginally above 2,454,530,697 at the year-end following an issue of new shares as restricted stock compensation, which also lifted share capital slightly to ¥259.9 billion. Treasury shares were little changed at 119,814,806, and the weighted-average share count for the quarter was 2,334,736,678. Panasonic noted an accounting-policy change required by IFRS during the period, with no other changes to policies or estimates and no material change to the scope of consolidation. The quarterly consolidated financial statements were not subject to review by a certified public accountant or an audit firm.
| Metric | Q1 FY3/2027 | Q1 FY3/2026 | YoY |
|---|---|---|---|
| Revenue (¥ million) | 2,018,914 | 1,896,691 | +6.4% |
| Gross profit (¥ million) | 665,899 | 603,751 | +10.3% |
| SG&A expenses (¥ million) | 479,469 | 512,272 | −6.4% |
| Operating profit (¥ million) | 182,455 | 86,903 | +110.0% |
| Operating margin (%) | 9.0 | 4.6 | +4.4 pt |
| Profit before tax (¥ million) | 188,947 | 90,977 | +107.7% |
| Quarterly net profit (¥ million) | 139,490 | 77,085 | +81.0% |
| Profit attributable to owners of parent (¥ million) | 135,173 | 71,463 | +89.2% |
| Basic EPS (¥) | 57.90 | 30.61 | +89.2% |
| Total comprehensive income (¥ million) | 249,991 | −31,515 | — |
| Total assets (¥ million, vs FY3/26 year-end) | 10,427,680 | 10,172,412 | +2.5% |
| Equity attributable to owners (¥ million, vs FY3/26 year-end) | 5,405,922 | 5,211,272 | +3.7% |
| Equity ratio (%, vs FY3/26 year-end) | 51.8 | 51.2 | +0.6 pt |
| FY3/27 revenue guidance (¥ million) | 7,800,000 | 8,048,700 | −3.1% |
| FY3/27 operating profit guidance (¥ million) | 590,000 | 236,400 | +149.6% |
| FY3/27 profit attributable to owners guidance (¥ million) | 450,000 | 189,500 | +137.4% |
| FY3/27 EPS guidance (¥) | 192.73 | 81.19 | +137.4% |
| Annual dividend (¥, FY3/27 forecast vs FY3/26 actual) | 54.00 | 40.00 | +¥14.00 |
JapanStockPulse provides informational content only and does not constitute investment advice. Figures are taken from the company's published earnings short report and may be subject to subsequent revision.