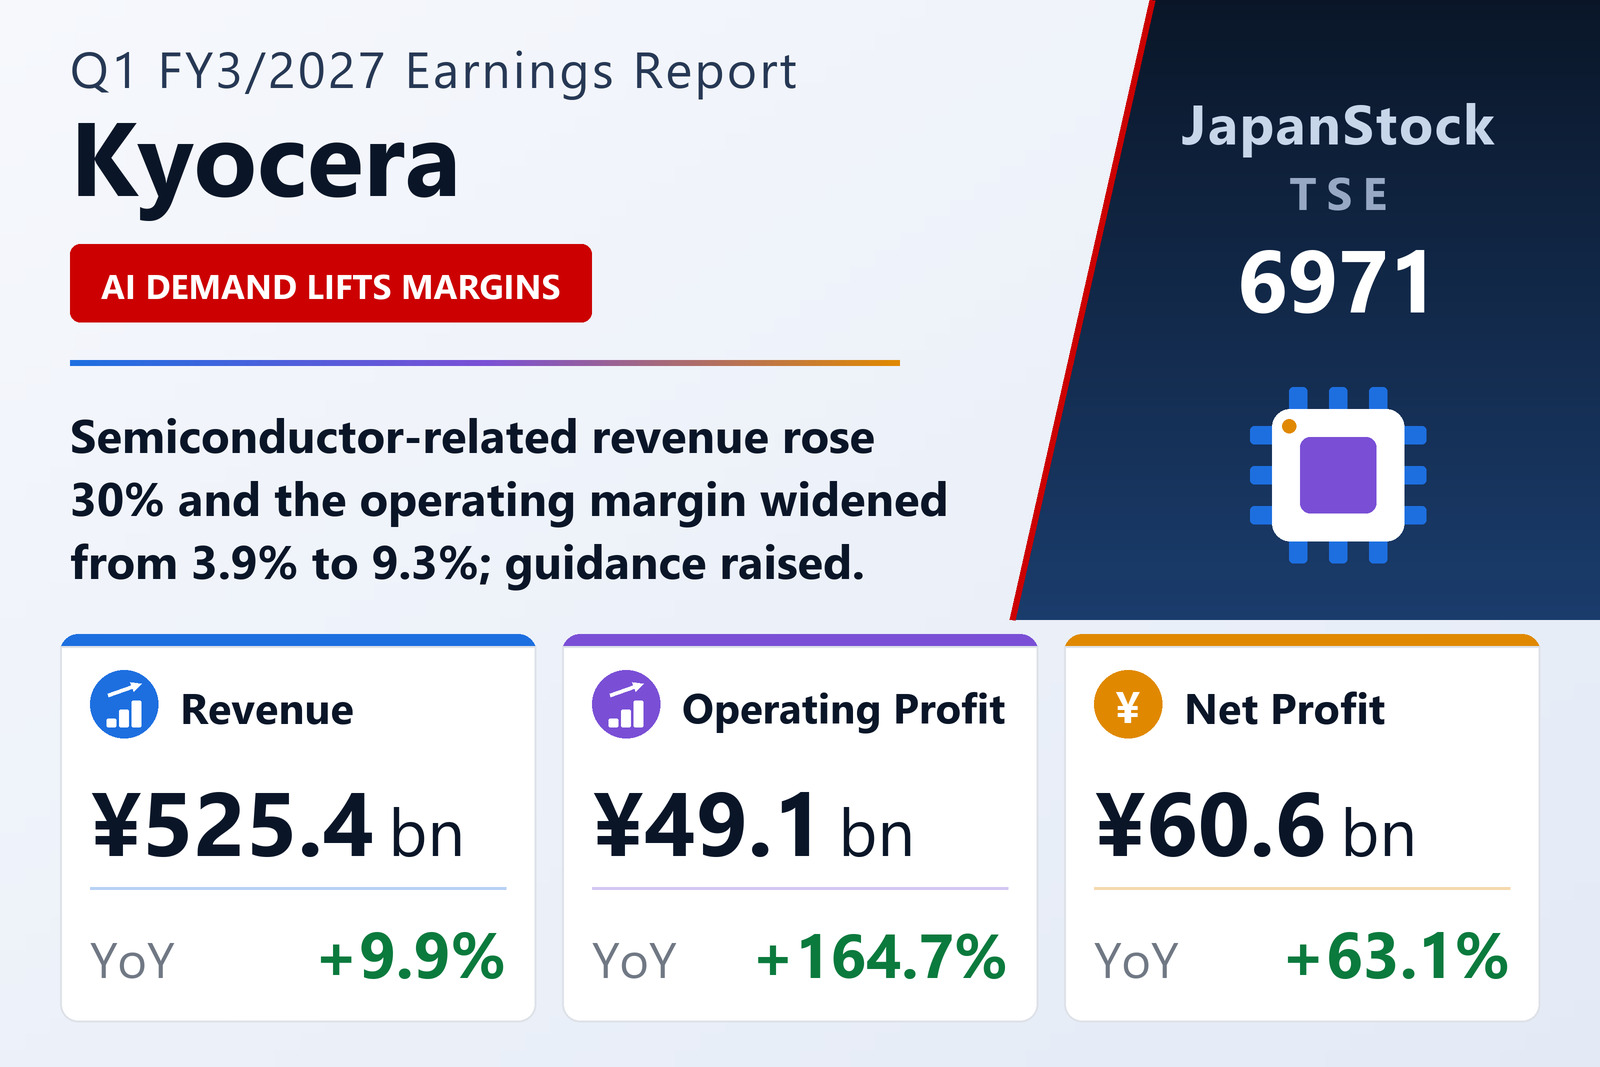
Kyocera Corporation (TSE: 6971) reported consolidated results for the first quarter of the year ending March 2027 — the three months from April 1 to June 30, 2026 — under IFRS. Revenue rose 9.9% to ¥525,383 million from ¥478,038 million, but the far larger move was below the top line: operating profit climbed 164.7% to ¥49,101 million from ¥18,550 million, profit before tax rose 68.1% to ¥74,891 million, and profit attributable to owners of the parent rose 63.1% to ¥60,576 million. Basic and diluted earnings per share were ¥46.20, up from ¥26.37. Gross profit expanded 18.3% to ¥166,543 million, lifting the gross margin from 29.4% to 31.7%, while selling, general and administrative expenses actually fell 3.9% to ¥117,442 million — 22.4% of revenue against 25.5% a year earlier. Roughly ten points of revenue growth translated into a 5.4-point operating margin expansion, and that combination of a richer sales mix with an absolute reduction in overhead is the whole story of the quarter.
Where the margin leverage came from
The demand driver named repeatedly in the disclosure is the AI data centre. Core Components revenue rose 22.1% to ¥178,081 million and segment profit 67.9% to ¥23,826 million, lifting the segment margin from 9.7% to 13.4%; within it, semiconductor-related components grew 30.1% to ¥106,106 million with profit nearly doubling — up 98.2% to ¥13,919 million — on fine-ceramic parts for semiconductor production equipment and semiconductor packages for AI servers, while industrial and automotive components rose 11.8% to ¥65,446 million with profit up 42.8% to ¥9,984 million. Electronic Components grew revenue 23.6% to ¥103,645 million and swung from a segment loss of ¥3,008 million to a profit of ¥8,782 million, an ¥11,790 million turnaround, on small high-capacitance MLCCs and tantalum capacitors for the same end market.
That Electronic Components swing deserves a caveat: the company states that the year-earlier quarter carried a one-off loss on a business transfer, and that this year's figure includes gains on property sales. Both flatter the comparison, so the underlying improvement is smaller than the headline reversal. Solutions is the mirror image — revenue fell 2.1% to ¥247,627 million because the US industrial-tools subsidiary was divested in January 2026, yet segment profit rose 60.7% to ¥30,333 million and the margin jumped from 7.5% to 12.2%. Industrial tools revenue dropped 29.0% to ¥56,842 million while its profit rose 78.9% to ¥11,723 million, a margin of 20.6% against 8.2%; document solutions grew 13.7% to ¥122,092 million with profit of ¥11,383 million, and communications revenue rose 5.2% to ¥47,977 million with profit of ¥3,307 million against just ¥206 million. Kyocera notes that stripping out the divestment, every business grew. Other businesses widened their loss to ¥6,323 million. Total business profit reached ¥56,618 million, up 129.7%.
The gap between operating and pre-tax profit
Profit before tax of ¥74,891 million sits ¥25,790 million above operating profit — a gap that is structural at Kyocera and worth understanding. Financial income of ¥27,512 million (down 4.6%) does most of the work, reflecting dividends and returns on the group's very large securities portfolio, chiefly its stake in KDDI. Financial costs fell 40.4% to ¥2,446 million, equity-method investment income was ¥141 million and other net items ¥583 million. In the company's own segment presentation the bridge is labelled corporate profit and loss, which contributed ¥18,273 million against ¥19,910 million a year earlier — down 8.2%, meaning essentially all of the pre-tax profit growth came from the operating businesses rather than from financial income. Tax expense nearly doubled to ¥13,428 million, so quarterly profit rose 62.7% to ¥61,463 million, of which ¥887 million went to non-controlling interests.
One number moved the other way. Total comprehensive income fell 16.1% to ¥89,634 million from ¥106,831 million even as profit surged, and the reason lies entirely in other comprehensive income, which shrank to ¥28,171 million from ¥69,061 million. In the year-earlier quarter, financial assets measured at fair value through OCI — again, principally the KDDI holding — contributed ¥77,104 million of unrealised revaluation gains; this quarter they contributed only ¥13,330 million. That was partly offset by foreign-currency translation of overseas operations swinging to a positive ¥14,451 million from a negative ¥7,919 million as the yen weakened. In short, the fall in comprehensive income is a mark-to-market artefact of the equity portfolio, not a deterioration in trading.
Full-year guidance revised sharply higher
Kyocera used the quarter to revise its FY3/2027 forecast upward, its first revision since the April 30, 2026 original. Revenue guidance rises from ¥1,940,000 million to ¥2,080,000 million (+0.5% year on year), operating profit from ¥130,000 million to ¥160,000 million (+35.4%), profit before tax from ¥170,000 million to ¥200,000 million (+18.3%) and profit attributable to owners from ¥141,000 million to ¥160,000 million (+13.5%), for basic EPS of ¥122.04. The company attributes the upgrade to demand across AI and semiconductor-related markets running ahead of plan, plus a weaker yen: the assumed average rates move to ¥155 per US dollar from ¥150, and to ¥180 per euro from ¥175. Segment revenue forecasts were lifted for Core Components (to ¥716,000 million from ¥654,000 million) and Electronic Components (to ¥415,000 million from ¥364,000 million). Capital expenditure guidance is unchanged at ¥225,000 million, a 50.9% increase on the prior year, with depreciation and R&D each budgeted at ¥120,000 million. Management still flags raw-material inflation and geopolitical risk as the reasons for caution from the second quarter onward.
¥124.8 billion of KDDI stock sold, 91 million shares cancelled
Two capital actions reshaped the share count and the balance sheet. Kyocera tendered part of its KDDI holding into that company's own share buyback, selling 53,681,800 shares at ¥2,325 each for ¥124,810 million and cutting its stake from 562,133,600 shares (14.77%) to 508,451,800 shares (13.36%). The resulting after-tax gain of ¥89,461 million was recognised in other components of equity and transferred straight to retained earnings — it does not appear in the profit figures above. Separately, following an April 30 board resolution, Kyocera cancelled 91,373,500 treasury shares on May 29, 2026, reducing shares issued from 1,510,474,320 to 1,419,100,820 and treasury stock from 193,068,328 to 120,769,576 shares. The average share count for the quarter fell to 1,311,047,671 from 1,408,748,003, which flatters EPS growth (+75.2%) relative to net profit growth (+63.1%). The dividend was left alone: FY3/2026 paid ¥52.00 in total (¥25.00 interim plus ¥27.00 year-end), and the FY3/2027 forecast stands at ¥56.00 (¥28.00 plus ¥28.00), unchanged from the previous forecast.
Balance sheet and cash flow
Total assets edged down ¥41,904 million to ¥4,604,410 million, as accounts receivable from the KDDI sale rose but equity securities and cash both fell. Total liabilities declined ¥26,194 million to ¥1,252,748 million on the partial release of deferred tax liabilities, and total equity slipped ¥15,710 million to ¥3,351,662 million — quarterly profit was more than offset by buybacks. Equity attributable to owners of the parent was ¥3,323,637 million, an equity ratio of 72.2%, up from 71.9%; few industrial groups anywhere carry that little leverage. Operating cash flow improved to ¥77,331 million from ¥72,719 million, and the investing outflow narrowed to ¥23,034 million from ¥40,609 million on lower property purchases. Financing outflow, however, ballooned to ¥110,529 million from ¥44,596 million on treasury-share purchases. With a ¥4,210 million positive translation effect, cash and equivalents fell ¥52,022 million over the quarter to ¥403,865 million.
| Metric | Q1 FY3/2027 | Q1 FY3/2026 | YoY |
|---|---|---|---|
| Revenue (¥ million) | 525,383 | 478,038 | +9.9% |
| Gross profit (¥ million) | 166,543 | 140,761 | +18.3% |
| SG&A expenses (¥ million) | 117,442 | 122,211 | −3.9% |
| Operating profit (¥ million) | 49,101 | 18,550 | +164.7% |
| Operating margin (%) | 9.3 | 3.9 | +5.4 pt |
| Financial income (¥ million) | 27,512 | 28,824 | −4.6% |
| Profit before tax (¥ million) | 74,891 | 44,563 | +68.1% |
| Profit attrib. to owners of parent (¥ million) | 60,576 | 37,143 | +63.1% |
| Total comprehensive income (¥ million) | 89,634 | 106,831 | −16.1% |
| Basic and diluted EPS (¥) | 46.20 | 26.37 | +75.2% |
| Core Components — revenue (¥ million) | 178,081 | 145,856 | +22.1% |
| Core Components — segment profit (¥ million) | 23,826 | 14,188 | +67.9% |
| Electronic Components — revenue (¥ million) | 103,645 | 83,864 | +23.6% |
| Electronic Components — segment profit (¥ million) | 8,782 | −3,008 | Swing to profit |
| Solutions — revenue (¥ million) | 247,627 | 253,007 | −2.1% |
| Solutions — segment profit (¥ million) | 30,333 | 18,879 | +60.7% |
| Total business profit (¥ million) | 56,618 | 24,653 | +129.7% |
| Operating cash flow (¥ million) | 77,331 | 72,719 | +6.3% |
| Financing cash flow (¥ million) | −110,529 | −44,596 | −¥65,933m |
| Total assets (¥ million, vs FY3/26 year-end) | 4,604,410 | 4,646,314 | −¥41,904m |
| Equity ratio (%, vs FY3/26 year-end) | 72.2 | 71.9 | +0.3 pt |
| Shares issued (incl. treasury) | 1,419,100,820 | 1,510,474,320 | −91,373,500 |
| FY3/27 revenue guidance (¥ million) | 2,080,000 | 1,940,000 | +¥140,000m revised |
| FY3/27 operating profit guidance (¥ million) | 160,000 | 130,000 | +¥30,000m revised |
| FY3/27 annual dividend forecast (¥) | 56.00 | 52.00 | +7.7% |
JapanStockPulse provides informational content only and does not constitute investment advice. Figures are taken from the company's published earnings short report and may be subject to subsequent revision.