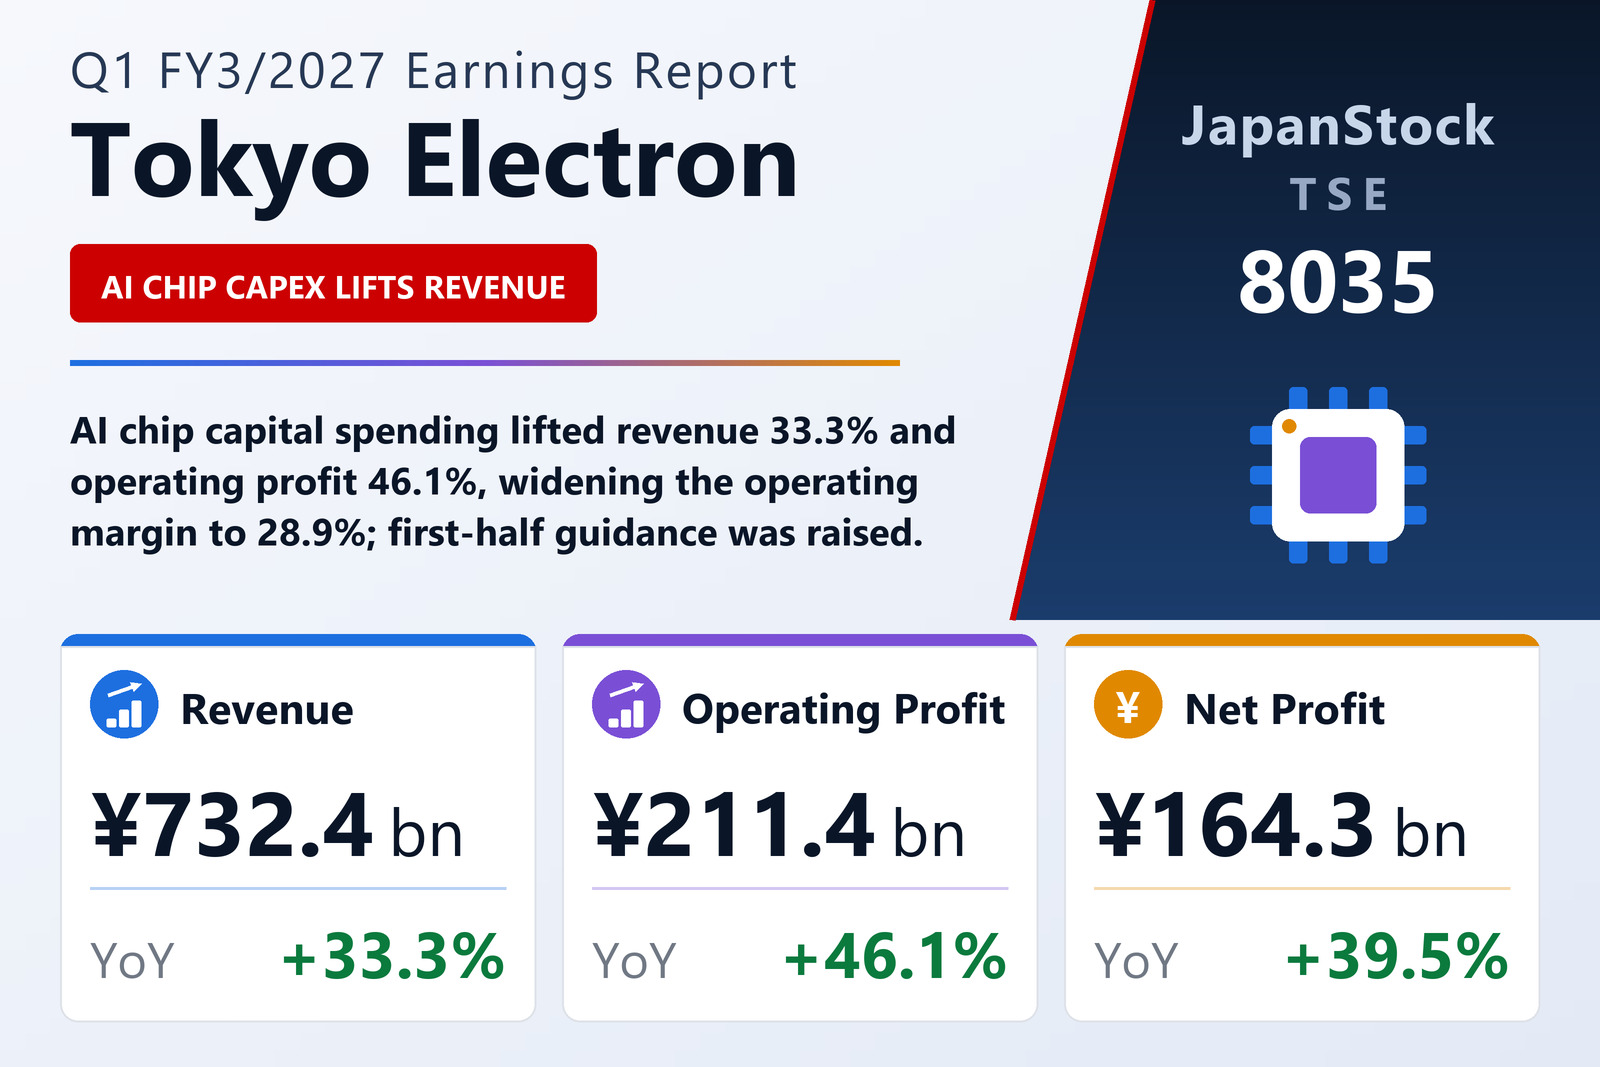
Tokyo Electron Limited (TSE: 8035), Japan's largest maker of semiconductor production equipment, reported consolidated results for the first quarter of the fiscal year ending March 2027 — the three months from April 1 to June 30, 2026 — under Japanese GAAP. Revenue rose 33.3% to ¥732,388 million, operating profit rose 46.1% to ¥211,407 million, recurring profit rose 46.3% to ¥215,626 million and net profit attributable to owners of the parent rose 39.5% to ¥164,341 million. The group reports a single segment — semiconductor production equipment — so no segment breakdown is provided. Alongside the quarter, the company raised its first-half forecast and lifted its interim dividend plan.
AI server capex, not the broad cycle, is doing the work
Tokyo Electron said demand for AI servers destined for data centres led growth across the whole semiconductor market during the quarter, and that within the production-equipment market, capital spending aimed at AI-use chips grew markedly year on year. The macro backdrop it described was less friendly: rising energy prices tied to heightened geopolitical tension in the Middle East pushed inflation higher in Europe and the United States, although the company judged the economy overall to be holding firm and said macro trends bear watching. Looking further out, it repeated its structural case — the shift to a data-driven society as information and communications technology advances, the evolution of AI toward productivity gains and new value creation, and efforts to decarbonise all raise the importance of semiconductors and of innovation in them, so the equipment market should keep growing over the medium to long term.
Operating leverage widens the margin by 2.6 points
Gross profit rose 34.9% to ¥342,712 million and the gross margin edged up to 46.8% from 46.2%. The bigger effect came one line lower: selling, general and administrative expenses rose 20.2% to ¥131,304 million, far more slowly than the 33.3% revenue gain, so their share of revenue fell to 17.9% from 19.9%. Research and development, the largest item inside SG&A, rose 15.9% to ¥72,046 million. The result was an operating margin of 28.9%, up from 26.3%. Below the operating line, net non-operating income of ¥4,219 million — including ¥1,158 million of dividends received and ¥1,952 million of subsidy income — carried recurring-profit growth to 46.3%. Net profit grew more slowly, at 39.5%, for two reasons: the year-earlier quarter carried ¥4,873 million of extraordinary gains, almost all of it a ¥4,849 million value-added-tax refund, against just ¥15 million this time; and the effective tax rate rose to 23.7% from 22.5% as the tax charge climbed to ¥51,153 million from ¥34,165 million. Net margin still improved, to 22.4% from 21.4%.
Securities revaluation, not operations, drove the balance sheet
Total assets reached ¥2,955,405 million at June 30, up ¥94,407 million from the March year-end. Current assets actually fell ¥32,446 million to ¥1,803,020 million: ¥54,998 million of securities ran off to nil and cash and deposits declined ¥41,644 million, more than offsetting a ¥38,434 million inventory build — inventories reached ¥751,551 million across finished goods, work in process and raw materials — and an ¥18,168 million rise in receivables and contract assets. All the growth sat in non-current assets. Investments and other assets jumped ¥104,632 million to ¥503,296 million on a ¥117,850 million increase in investment securities that is a revaluation rather than a purchase: the unrealised gain on other securities inside equity rose ¥80,618 million to ¥228,581 million over the same three months. Property, plant and equipment rose ¥21,032 million to ¥610,367 million. On the liability side, current liabilities were nearly flat at ¥684,874 million as ¥23,834 million more in advances received and ¥16,058 million more in trade payables were offset by a ¥45,130 million drop in income taxes payable. Net assets rose ¥72,905 million to ¥2,142,901 million and the equity ratio was 71.7%, against 71.5% at the year-end. Retained earnings nonetheless fell ¥97,312 million to ¥1,986,059 million, because the ¥166,041 million year-end dividend was paid and treasury stock shrank to ¥336,437 million from ¥420,660 million — the pattern of a cancellation of previously repurchased shares.
Operating cash flow up 58%, but ¥178bn went out to shareholders
Operating cash flow rose ¥43,790 million to ¥118,745 million. Pre-tax profit of ¥215,495 million and ¥22,509 million of depreciation supplied the inflow, together with ¥23,564 million more in advances received and a ¥14,727 million rise in trade payables. Against that, tax payments of ¥100,184 million and the ¥36,269 million inventory build were the largest drains, and receivables consumed ¥15,368 million after releasing ¥94,146 million a year earlier. Investing outflows narrowed to ¥38,520 million from ¥54,178 million as purchases of property, plant and equipment fell to ¥34,304 million from ¥51,018 million, leaving free cash flow of roughly ¥80,225 million. Financing outflows widened to ¥178,477 million from ¥151,134 million, comprising ¥166,041 million of dividends and ¥11,478 million of share repurchases. Cash and equivalents ended the quarter at ¥408,413 million, down ¥97,000 million from the year-end; including time deposits and short-term investments maturing in more than three months, the balance was ¥409,608 million.
First-half guidance raised; interim dividend lifted to ¥384
Citing the latest customer capital-spending trends, Tokyo Electron revised the first-half forecast it published on April 30, 2026. Guidance for the six months to September 30 rises 3.2% to ¥1,620,000 million of revenue from ¥1,570,000 million, 6.3% to ¥458,000 million of operating profit from ¥431,000 million, 6.2% to ¥464,000 million of recurring profit and 6.4% to ¥349,000 million of net profit from ¥328,000 million — taking guided first-half EPS to ¥767.51 from ¥721.12. Measured against the year-earlier half, which delivered revenue of ¥1,179,668 million, operating profit of ¥303,153 million and net profit of ¥241,626 million, the revised plan implies growth of 37.3%, 51.1% and 44.4%. The first quarter already accounts for 45.2% of the guided half-year revenue and 46.2% of the guided operating profit. Full-year guidance was not provided; the company said it will disclose it when it reports interim results. Its dividend policy is performance-linked and targets a payout ratio of about 50% of net profit attributable to owners, and in step with the upgrade it raised the interim dividend forecast to ¥384.00 per share from ¥361.00, against ¥264.00 paid at the interim stage a year earlier. The year-end dividend is undetermined and will be announced with full-year guidance; the year ended March 2026 paid ¥628.00 in total. Separately, the company said the Kumamoto earthquake of July 28, 2026 caused no significant damage to group buildings or equipment and that it judges the impact on results to be minor at this stage.
| Metric | Q1 FY3/2027 | Q1 FY3/2026 | YoY |
|---|---|---|---|
| Revenue (¥ million) | 732,388 | 549,586 | +33.3% |
| Gross profit (¥ million) | 342,712 | 253,970 | +34.9% |
| Operating profit (¥ million) | 211,407 | 144,694 | +46.1% |
| Operating margin (%) | 28.9 | 26.3 | +2.6 pt |
| Recurring profit (¥ million) | 215,626 | 147,347 | +46.3% |
| Net profit attributable to owners (¥ million) | 164,341 | 117,801 | +39.5% |
| R&D expenses (¥ million) | 72,046 | 62,141 | +15.9% |
| Operating cash flow (¥ million) | 118,745 | 74,955 | +58.4% |
| Total assets (¥ million, vs FY3/26 year-end) | 2,955,405 | 2,860,997 | +3.3% |
| Equity ratio (%, vs FY3/26 year-end) | 71.7 | 71.5 | +0.2 pt |
| H1 FY3/27 revenue guidance (¥ million, new vs previous) | 1,620,000 | 1,570,000 | +3.2% |
| H1 FY3/27 operating profit guidance (¥ million, new vs previous) | 458,000 | 431,000 | +6.3% |
| Interim dividend (¥, new vs previous forecast) | 384.00 | 361.00 | +¥23.00 |
JapanStockPulse provides informational content only and does not constitute investment advice. Figures are taken from the company's published earnings short report and may be subject to subsequent revision.