Three different companies inside one income statement
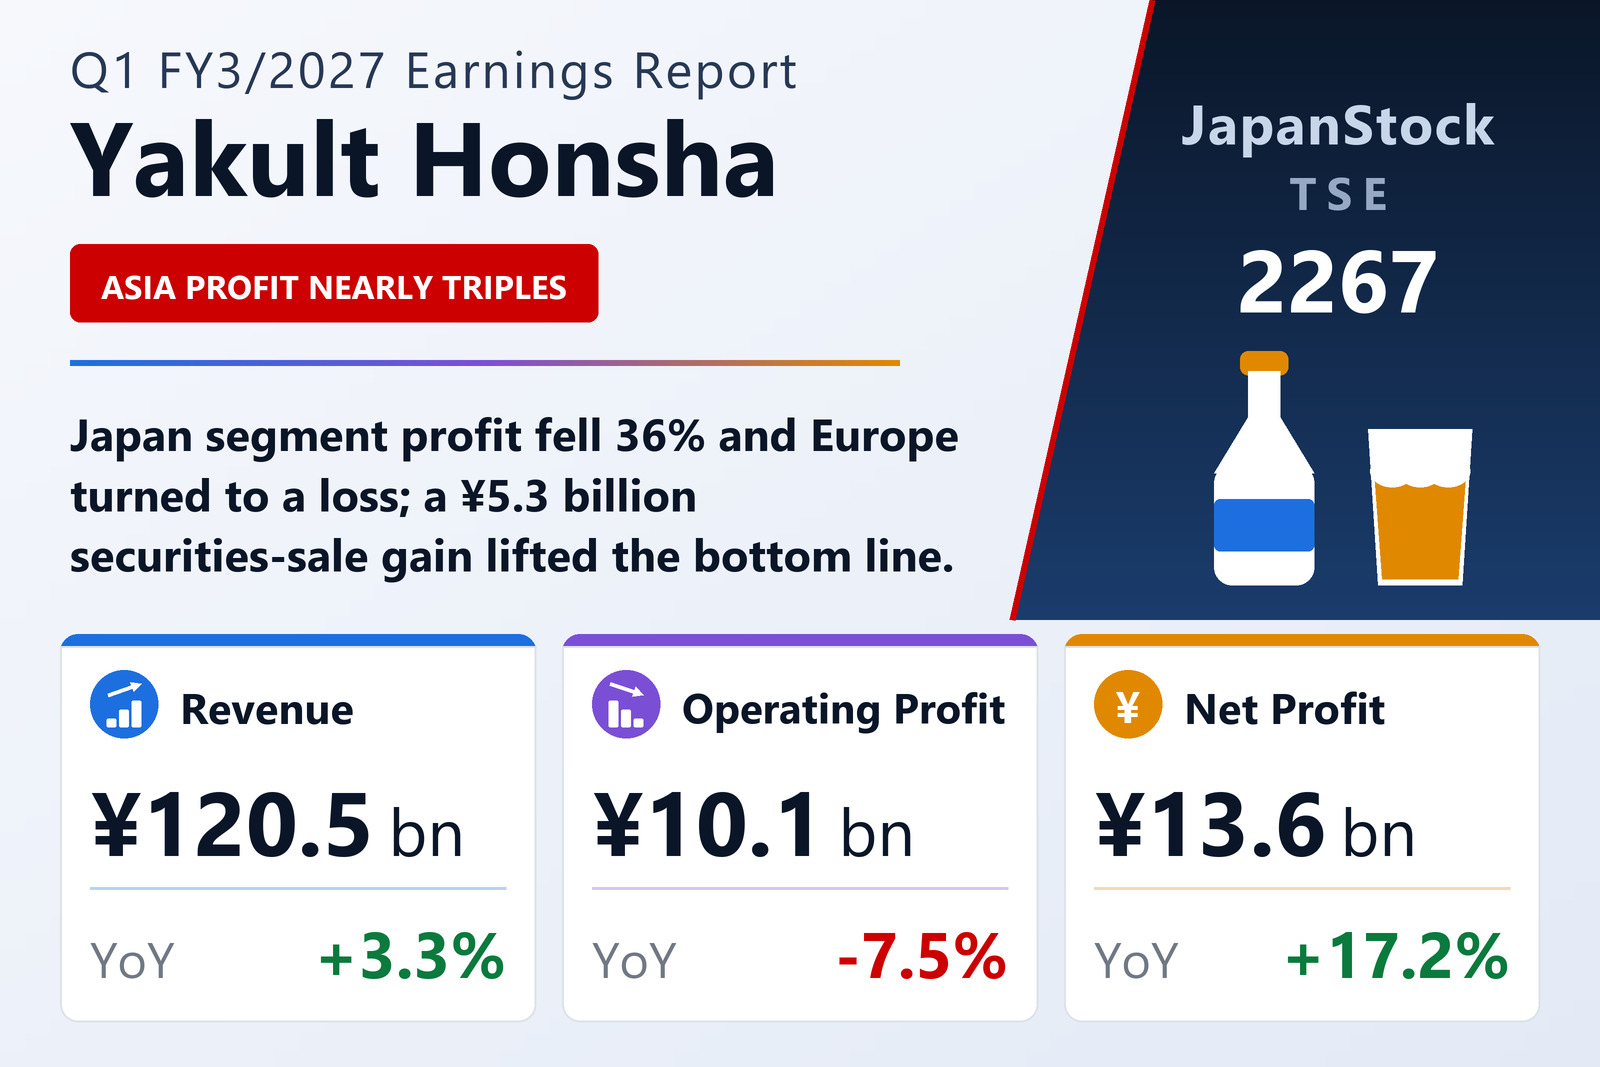
Yakult Honsha Co., Ltd. (TSE: 2267) published consolidated first-quarter results for FY3/2027 on July 31, 2026, covering April 1 to June 30, 2026 under Japanese GAAP. At group level the quarter reads as modest growth and mild profit erosion: revenue up 3.3% to ¥120,463 million, operating profit down 7.5% to ¥10,088 million, ordinary profit down 9.0% to ¥15,647 million, and net profit attributable to owners of parent up 17.2% to ¥13,591 million. Every one of those four lines is being driven by something different, and the segment table is where the quarter actually happens.
The gross margin was not the problem. Cost of sales rose only 1.8% against revenue growth of 3.3%, so gross profit rose 4.4% to ¥71,677 million and the gross margin widened to 59.50% from 58.88%. What consumed the gain — and more — was selling, general and administrative expenses, up 6.7% to ¥61,589 million, twice the pace of revenue. The SG&A ratio rose to 51.13% from 49.53%, and that 1.6-point increase is the whole of the operating-margin decline from 9.35% to 8.37%.
Japan shrank; the overseas business paid for it
The Japan beverages and food segment — still the largest at ¥55,368 million including intersegment sales — saw revenue fall 7.2% and segment profit fall 35.6% to ¥5,658 million from ¥8,784 million. That ¥3,126 million decline is roughly four times the ¥818 million fall in group operating profit; without the rest of the group, the quarter would have been far worse.
The company's own account of Japan is a list of activity followed by an admission. On the home-delivery channel it pushed new-customer acquisition around the Yakult 1000 range and worked to strengthen the Yakult Lady organisation; at retail it built high-visibility displays for New Yakult and Y1000 and deployed in-store promotion staff. Product news was genuine: a limited-run New Yakult Muscat flavour from April, borrowed from the overseas range; Yakult 400 and 400LT relaunched in June as functional-claim foods labelled for immune-function maintenance and gut-environment improvement; and Mil-Mil and Mil-Mil S reformulated in June to raise Bifidobacterium BY-strain counts from 12 billion to over 20 billion per bottle. The vinegar drink Kurozu got a new package in June. Despite all of it, the company says the harsh market environment created by price inflation left both dairy drinks and soft drinks below the prior year.
Overseas is where the growth is, and it is broad. The Americas grew revenue 18.7% to ¥25,751 million and segment profit 9.0% to ¥6,922 million — profit growing at half the rate of revenue, so the region is buying its growth. Asia/Oceania grew revenue 14.4% to ¥33,687 million and segment profit 145.8% to ¥3,137 million, by far the best operating leverage in the group; Indonesia (Yakult Strawberry, launched June, plus expansion into school-meal centres and hospitals), China (Yakult Mango from April, a rebuilt route structure for small and mid-sized stores, and a strengthened e-commerce set-up) and Vietnam (Yakult Peach from April) are all named as strong. On these figures Asia/Oceania has now overtaken Japan-ex-intersegment as the group's largest source of bottle volume growth.
Europe is the one clear negative: revenue grew 14.2% to ¥3,656 million on advertising and in-store promotion, but the segment swung to a loss of ¥182 million from a ¥16 million profit — spending ahead of scale in the group's smallest region. The Other segment, which holds cosmetics and the Tokyo Yakult Swallows baseball franchise, saw revenue slip 2.8% to ¥5,552 million yet turned a ¥185 million loss into a ¥76 million profit. Corporate costs and eliminations widened 3.6% to ¥5,524 million.
One operating statistic frames the international business better than any revenue line: across 39 countries and regions, served from 26 offices, one research institute and one R&D centre, the group sold an average of about 31.92 million bottles a day in June.
Below the operating line, asset sales decide the outcome
Non-operating income of ¥6,747 million was slightly below the prior year's ¥6,898 million, while non-operating expenses nearly doubled to ¥1,188 million from ¥615 million, taking ordinary profit down 9.0% to ¥15,647 million — a steeper fall than operating profit.
Then the direction reverses. Extraordinary gains reached ¥6,642 million against ¥1,483 million, of which a ¥5,292 million gain on the sale of investment securities — cross-shareholding disposals, up from ¥1,419 million a year earlier — is the dominant item, alongside ¥1,243 million of gains on fixed-asset sales. Extraordinary losses rose to ¥857 million from ¥35 million, including a ¥788 million loss on the sale of subsidiary shares. Net of everything, pre-tax profit rose 15.0% to ¥21,431 million. After tax of ¥6,473 million and ¥1,367 million to non-controlling interests, net profit attributable to owners of parent was ¥13,591 million, up 17.2%, and EPS ¥46.99 against ¥39.36.
The distinction matters for anyone reading the headline growth. Operating profit fell; net profit rose; the difference is the disposal of assets, not trading. Comprehensive income of ¥21,257 million against a negative ¥5,498 million a year earlier is a similarly non-operational swing, driven by currency translation and valuation movements — the equity-method share alone moved from negative ¥24,322 million to positive ¥6,142 million.
A balance sheet reshaped by buybacks
Total assets rose 0.7% to ¥918,938 million, an increase of ¥6,360 million. Net assets moved the other way, falling 0.4% to ¥651,831 million, and the company attributes the ¥2,490 million decline to two things: the acquisition of treasury shares and a lower valuation difference on available-for-sale securities. Shareholders' equity fell 0.8% to ¥601,346 million and the equity ratio eased to 65.4% from 66.4%.
That is a deliberate use of the balance sheet rather than a weakening of it. A company earning ¥13.6 billion in a quarter, selling ¥5.3 billion of cross-shareholdings and buying back its own stock is converting non-core assets into shareholder returns; a 1.0-point drop in the equity ratio from 66.4% leaves ample room.
Guidance held — and it implies a very different rest of the year
Yakult left the forecast published on May 12, 2026 unchanged. For FY3/2027 it guides revenue of ¥527,000 million, up 8.3%, operating profit of ¥44,000 million, down 2.6%, ordinary profit of ¥57,500 million, down 5.9%, and net profit of ¥46,500 million, up 5.1%, for EPS of ¥174.21. The interim plan is revenue of ¥260,000 million, up 7.8%, with operating profit of ¥22,500 million, down 11.2%.
Two things stand out when the quarter is set against that plan. First, the revenue guidance requires acceleration: the group grew 3.3% in the first quarter against a full-year target of 8.3%, and the first quarter represents only 22.9% of guided revenue. Second, the profit guidance already assumes decline — down 2.6% for the year — so a 7.5% first-quarter fall is not itself off-plan, and at ¥10,088 million the quarter delivered 22.9% of guided operating profit, almost exactly a straight-line share. Net profit is the line running ahead: ¥13,591 million is 29.2% of the full-year target, but that is the securities gain, and it is not a run rate.
The dividend rises. FY3/2026 paid ¥70.00 per share — ¥33.00 interim and ¥37.00 at the year-end — and FY3/2027 is guided at ¥72.00, split evenly as ¥36.00 and ¥36.00, unchanged from the previously published forecast. On guided EPS that is a payout ratio of roughly 41%.
| Metric | Q1 FY3/2027 | Q1 FY3/2026 | Change |
|---|---|---|---|
| Revenue (¥ million) | 120,463 | 116,586 | +3.3% |
| Gross profit (¥ million) | 71,677 | 68,652 | +4.4% |
| Gross margin | 59.50% | 58.88% | +0.62 pt |
| SG&A expenses (¥ million) | 61,589 | 57,745 | +6.7% |
| Operating profit (¥ million) | 10,088 | 10,906 | −7.5% |
| Operating margin | 8.37% | 9.35% | −0.98 pt |
| Ordinary profit (¥ million) | 15,647 | 17,190 | −9.0% |
| Extraordinary gains (¥ million) | 6,642 | 1,483 | +347.9% |
| — of which gain on sale of investment securities (¥ million) | 5,292 | 1,419 | +272.9% |
| Extraordinary losses (¥ million) | 857 | 35 | +2,348.6% |
| Pre-tax profit (¥ million) | 21,431 | 18,638 | +15.0% |
| Net profit attrib. to owners of parent (¥ million) | 13,591 | 11,597 | +17.2% |
| Comprehensive income (¥ million) | 21,257 | −5,498 | loss to profit |
| EPS (¥) | 46.99 | 39.36 | +19.4% |
| Beverages & food — Japan — revenue (¥ million) | 55,368 | 59,633 | −7.2% |
| Beverages & food — Japan — segment profit (¥ million) | 5,658 | 8,784 | −35.6% |
| Beverages & food — Americas — revenue (¥ million) | 25,751 | 21,686 | +18.7% |
| Beverages & food — Americas — segment profit (¥ million) | 6,922 | 6,348 | +9.0% |
| Beverages & food — Asia/Oceania — revenue (¥ million) | 33,687 | 29,457 | +14.4% |
| Beverages & food — Asia/Oceania — segment profit (¥ million) | 3,137 | 1,276 | +145.8% |
| Beverages & food — Europe — revenue (¥ million) | 3,656 | 3,200 | +14.2% |
| Beverages & food — Europe — segment profit (¥ million) | −182 | 16 | profit to loss |
| Other — revenue (¥ million) | 5,552 | 5,711 | −2.8% |
| Other — segment profit (¥ million) | 76 | −185 | loss to profit |
| Corporate expense and eliminations (¥ million) | −5,524 | −5,332 | +3.6% |
| Total assets (¥ million) | 918,938 | 912,578 | +0.7% |
| Net assets (¥ million) | 651,831 | 654,321 | −0.4% |
| Shareholders' equity (¥ million) | 601,346 | 606,201 | −0.8% |
| Equity ratio | 65.4% | 66.4% | −1.0 pt |
| FY3/2027 guidance — revenue (¥ million) | 527,000 | — | +8.3% |
| FY3/2027 guidance — operating profit (¥ million) | 44,000 | — | −2.6% |
| FY3/2027 guidance — ordinary profit (¥ million) | 57,500 | — | −5.9% |
| FY3/2027 guidance — net profit (¥ million) | 46,500 | — | +5.1% |
| FY3/2027 guidance — EPS (¥) | 174.21 | — | — |
| Annual dividend per share (¥) | 72.00 | 70.00 | +2.9% |
JapanStockPulse provides informational content only and does not constitute investment advice. Figures are taken from the company's published earnings short report and may be subject to subsequent revision.