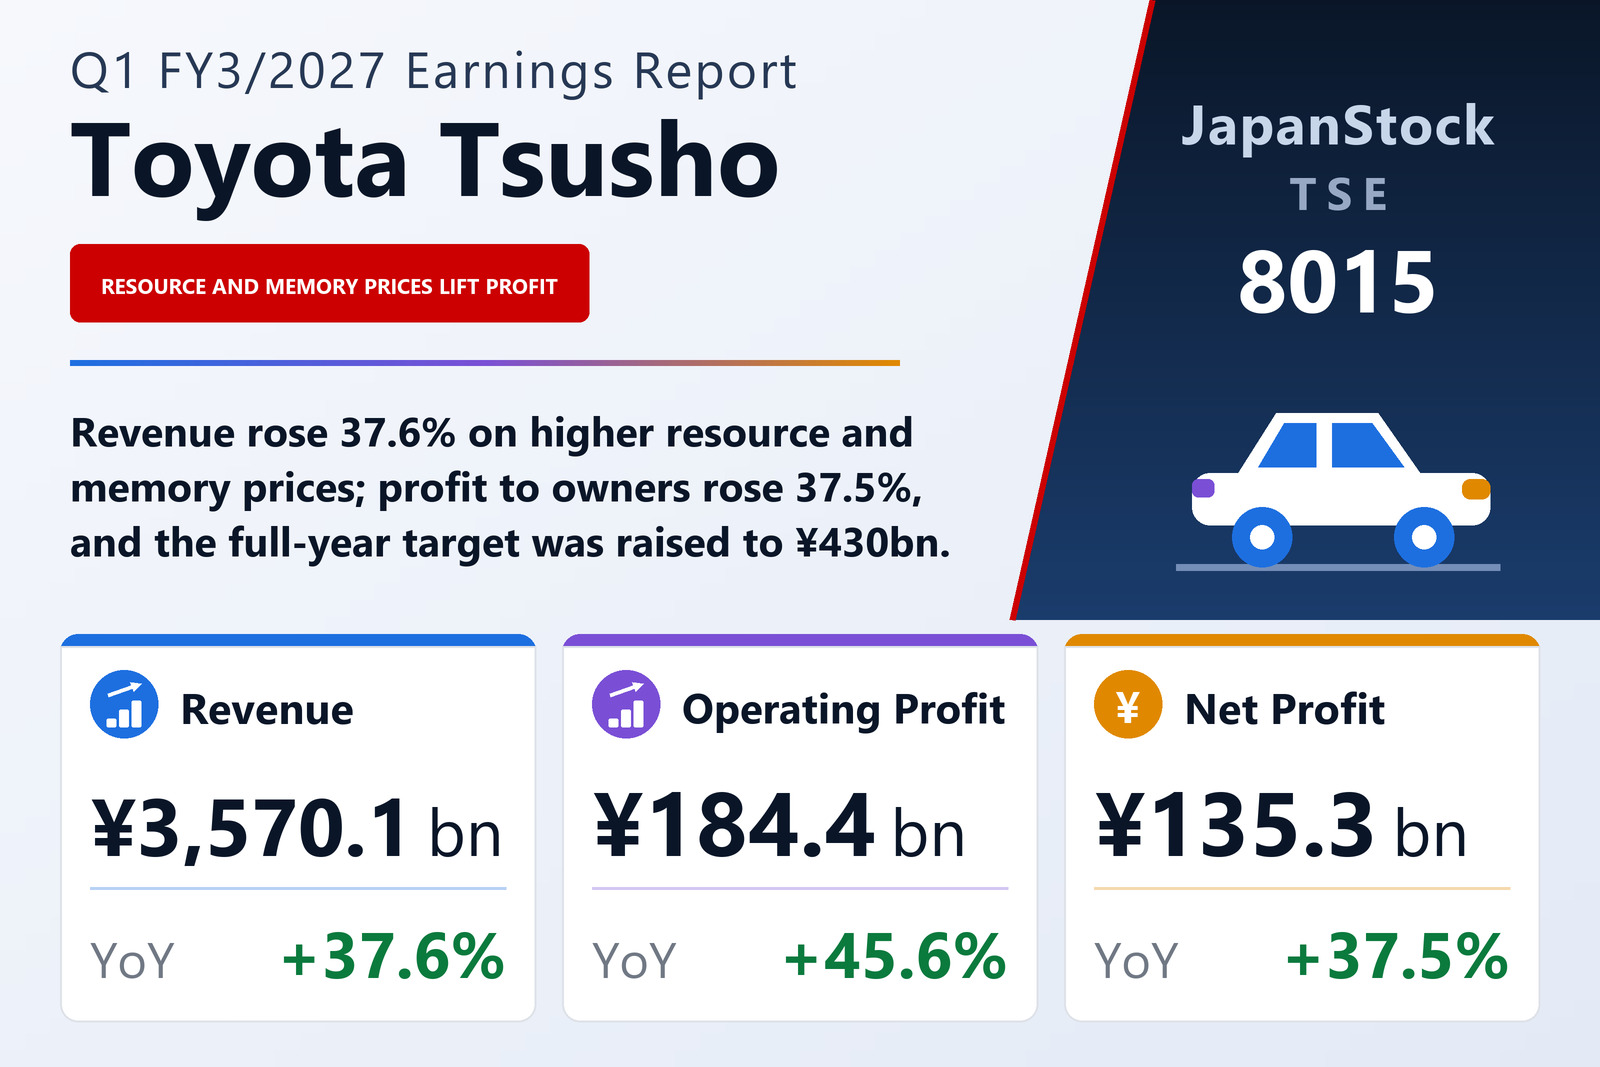
Revenue up 37.6%, profit to owners up 37.5%
Toyota Tsusho Corporation (TSE: 8015), the trading company whose eight reporting segments run from metals and the circular economy to mobility, digital solutions and Africa, published consolidated results for the first quarter of FY3/2027 — the three months from April 1 to June 30, 2026 — on July 31, 2026 under IFRS. Its shares are listed on the Tokyo and Nagoya stock exchanges. Revenue rose 37.6% to ¥3,570,117 million, operating profit — the filing's profit from operating activities — 45.6% to ¥184,379 million, pre-tax profit 41.1% to ¥204,724 million and profit attributable to owners of the parent 37.5% to ¥135,260 million from ¥98,344 million.
Basic earnings per share were ¥130.55 against ¥93.16, up 40.1% — faster than profit, because the average number of shares outstanding fell to 1,036,093,544 from 1,055,663,866. The filing attributes the revenue increase to higher resource prices and rising memory-related market prices, among other factors.
The gross margin narrowed; SG&A grew more slowly than gross profit
Cost of sales rose slightly faster than revenue, 38.1% to ¥3,194,022 million, so gross profit grew 34.2% to ¥376,095 million and the gross margin narrowed from 10.8% to 10.5%. Selling, general and administrative expenses rose 21.5% to ¥191,084 million, well short of the growth in gross profit, and that gap is what widened the operating margin from 4.9% to 5.2%. Other income and expenses swung to a net charge of ¥631 million from a net gain of ¥3,607 million, including a ¥204 million impairment loss on fixed assets that had no counterpart a year earlier. The filing's own explanation of the operating result is the same: higher gross profit outweighing higher SG&A.
Below the operating line, equity-method profit and minority interests both grew
Net financial income eased 4.5% to ¥9,973 million: interest income rose to ¥8,307 million and dividends received to ¥17,993 million, but interest expense climbed to ¥17,570 million from ¥12,971 million. Share of profit of equity-method investees rose 29.1% to ¥10,371 million, which the filing names, alongside the operating improvement, as a driver of attributable profit. Income taxes of ¥55,412 million put the effective rate at about 27.1%, against 27.6% a year earlier, and profit for the quarter was ¥149,312 million, up 42.1%.
Non-controlling interests took ¥14,051 million, more than double the ¥6,725 million of a year earlier, which is why profit attributable to owners grew 37.5% rather than 42.1%. Total comprehensive income rose 52.4% to ¥175,007 million, lifted by ¥28,066 million of exchange differences on translating foreign operations against a negative ¥6,223 million a year earlier.
Memory and resource prices more than doubled two segments' profit
Profit attributable to owners across the eight reporting segments rose 39.1% to ¥133,463 million from ¥95,972 million, and six of the eight grew. The two largest moves came from market prices. Digital Solutions more than doubled, to ¥18,410 million from ¥8,638 million (+113.1%), on rising memory-related prices; its revenue, including intersegment sales, rose 101.3% to ¥731,281 million, making it the largest segment by revenue. Circular Economy rose 119.3% to ¥26,567 million from ¥12,115 million on higher resource prices, with revenue up 52.4% to ¥693,881 million. Africa remained the largest profit contributor at ¥28,140 million, up 25.2%, on higher vehicle sales centred on Central and West Africa.
Mobility rose 35.1% to ¥20,668 million on higher overseas vehicle sales, mainly in Australia, Asia and Europe, and Supply Chain 33.9% to ¥18,812 million on auto-parts business centred on North America. Metal+ (Plus), reorganised in April 2026 from a product-based to a region- and mission-based structure, rose 11.8% to ¥12,750 million; the filing says lower steel prices were outweighed by the weaker yen, among other factors. Two segments fell. Green Infrastructure dropped 29.6% to ¥5,459 million on lower power generation in Japan and reduced machinery business, and Lifestyle fell 37.6% to ¥2,653 million, as higher volumes in the South American food business were outweighed by falling market prices.
A ¥663.7 billion share buyback cut owners' equity by 18%
The quarter's largest single item was a share repurchase. Toyota Tsusho spent ¥663,699 million acquiring its own shares and cancelled them within the quarter: issued shares fell by 118,095,432 to 944,074,116, while treasury stock was almost unchanged at 6,393,628 shares. The filing does not say from whom the shares were bought. The cancellation was charged against retained earnings, which fell by ¥591,381 million to ¥1,935,529 million, so equity attributable to owners of the parent dropped 18.1% to ¥2,587,489 million and the ratio of owners' equity to total assets fell from 37.0% to 30.8%. Total assets slipped 1.4% to ¥8,403,866 million: trade and other receivables rose ¥134,447 million and inventories ¥122,069 million, while cash and cash equivalents fell ¥484,079 million to ¥919,684 million.
The cash-flow statement shows how it was paid for. Operating activities used ¥54,210 million, against an inflow of ¥34,620 million a year earlier, as income taxes paid rose to ¥151,011 million from ¥55,485 million and working capital absorbed cash: ¥121,219 million went into receivables and ¥98,504 million into inventories, partly offset by ¥150,803 million from higher payables. Investing activities used ¥49,695 million, including ¥46,314 million of property, plant and equipment. Financing activities used ¥389,877 million: the buyback and ¥65,497 million of dividends were partly funded by a net ¥258,828 million increase in short-term borrowings, ¥74,491 million of new long-term borrowings and ¥58,600 million of bonds. Bonds and borrowings rose to ¥2,545,102 million from ¥2,168,735 million.
Full-year profit target raised 7.5% to ¥430 billion; dividend forecast unchanged
Toyota Tsusho publishes full-year guidance only for profit attributable to owners of the parent, and revised it on the same day, July 31, 2026. It now expects ¥430,000 million for FY3/2027, up 16.1% year on year and ¥30,000 million (7.5%) above the ¥400,000 million announced on April 30, 2026, for earnings per share of ¥458.58. The filing gives two reasons: the first-quarter results, and a revision of its exchange-rate assumption toward a weaker yen. The quarter just reported delivered 31.5% of the new target.
The dividend forecast was not revised: ¥62.00 at the half-year and ¥63.00 at the year-end, for an annual ¥125.00 against ¥120.00 for FY3/2026, up 4.2%.
| Metric | Q1 FY3/2027 | Q1 FY3/2026 | Change |
|---|---|---|---|
| Revenue (¥ million) | 3,570,117 | 2,593,820 | +37.6% |
| Gross profit (¥ million) | 376,095 | 280,323 | +34.2% |
| Gross margin | 10.5% | 10.8% | −0.3 pt |
| SG&A expenses (¥ million) | 191,084 | 157,335 | +21.5% |
| Operating profit (¥ million) | 184,379 | 126,595 | +45.6% |
| Operating margin | 5.2% | 4.9% | +0.3 pt |
| Share of profit of equity-method investees (¥ million) | 10,371 | 8,035 | +29.1% |
| Pre-tax profit (¥ million) | 204,724 | 145,071 | +41.1% |
| Net profit (¥ million) | 149,312 | 105,070 | +42.1% |
| Net profit attrib. to owners of parent (¥ million) | 135,260 | 98,344 | +37.5% |
| Comprehensive income (¥ million) | 175,007 | 114,802 | +52.4% |
| EPS (¥) | 130.55 | 93.16 | +40.1% |
| Metal+ (Plus) — segment profit (¥ million) | 12,750 | 11,402 | +11.8% |
| Circular Economy — segment profit (¥ million) | 26,567 | 12,115 | +119.3% |
| Supply Chain — segment profit (¥ million) | 18,812 | 14,046 | +33.9% |
| Mobility — segment profit (¥ million) | 20,668 | 15,294 | +35.1% |
| Green Infrastructure — segment profit (¥ million) | 5,459 | 7,756 | −29.6% |
| Digital Solutions — segment profit (¥ million) | 18,410 | 8,638 | +113.1% |
| Lifestyle — segment profit (¥ million) | 2,653 | 4,249 | −37.6% |
| Africa — segment profit (¥ million) | 28,140 | 22,469 | +25.2% |
| Total assets (¥ million) | 8,403,866 | 8,523,667 | −1.4% |
| Net assets (¥ million) | 2,729,557 | 3,301,147 | −17.3% |
| Equity attrib. to owners of parent (¥ million) | 2,587,489 | 3,157,520 | −18.1% |
| Equity ratio | 30.8% | 37.0% | −6.2 pt |
| Operating cash flow (¥ million) | −54,210 | 34,620 | n.m. |
| Investing cash flow (¥ million) | −49,695 | −42,878 | n.m. |
| Financing cash flow (¥ million) | −389,877 | −33,496 | n.m. |
| Purchase of treasury shares (¥ million) | −663,699 | −1 | n.m. |
| FY3/2027 guidance — net profit attrib. to owners of parent (¥ million) | 430,000 | — | +16.1% |
| FY3/2027 guidance — EPS (¥) | 458.58 | — | — |
| Annual dividend per share (¥) | 125.00 | 120.00 | +4.2% |
JapanStockPulse provides informational content only and does not constitute investment advice. Figures are taken from the company's published earnings short report and may be subject to subsequent revision.