Three lines, three different stories
Kansai Electric Power Co., Inc. (TSE: 9503) published consolidated results for the three months to June 30, 2026 on July 31, 2026 under Japanese GAAP. The three headline profit measures move in different directions this quarter, which makes reading them in order essential.
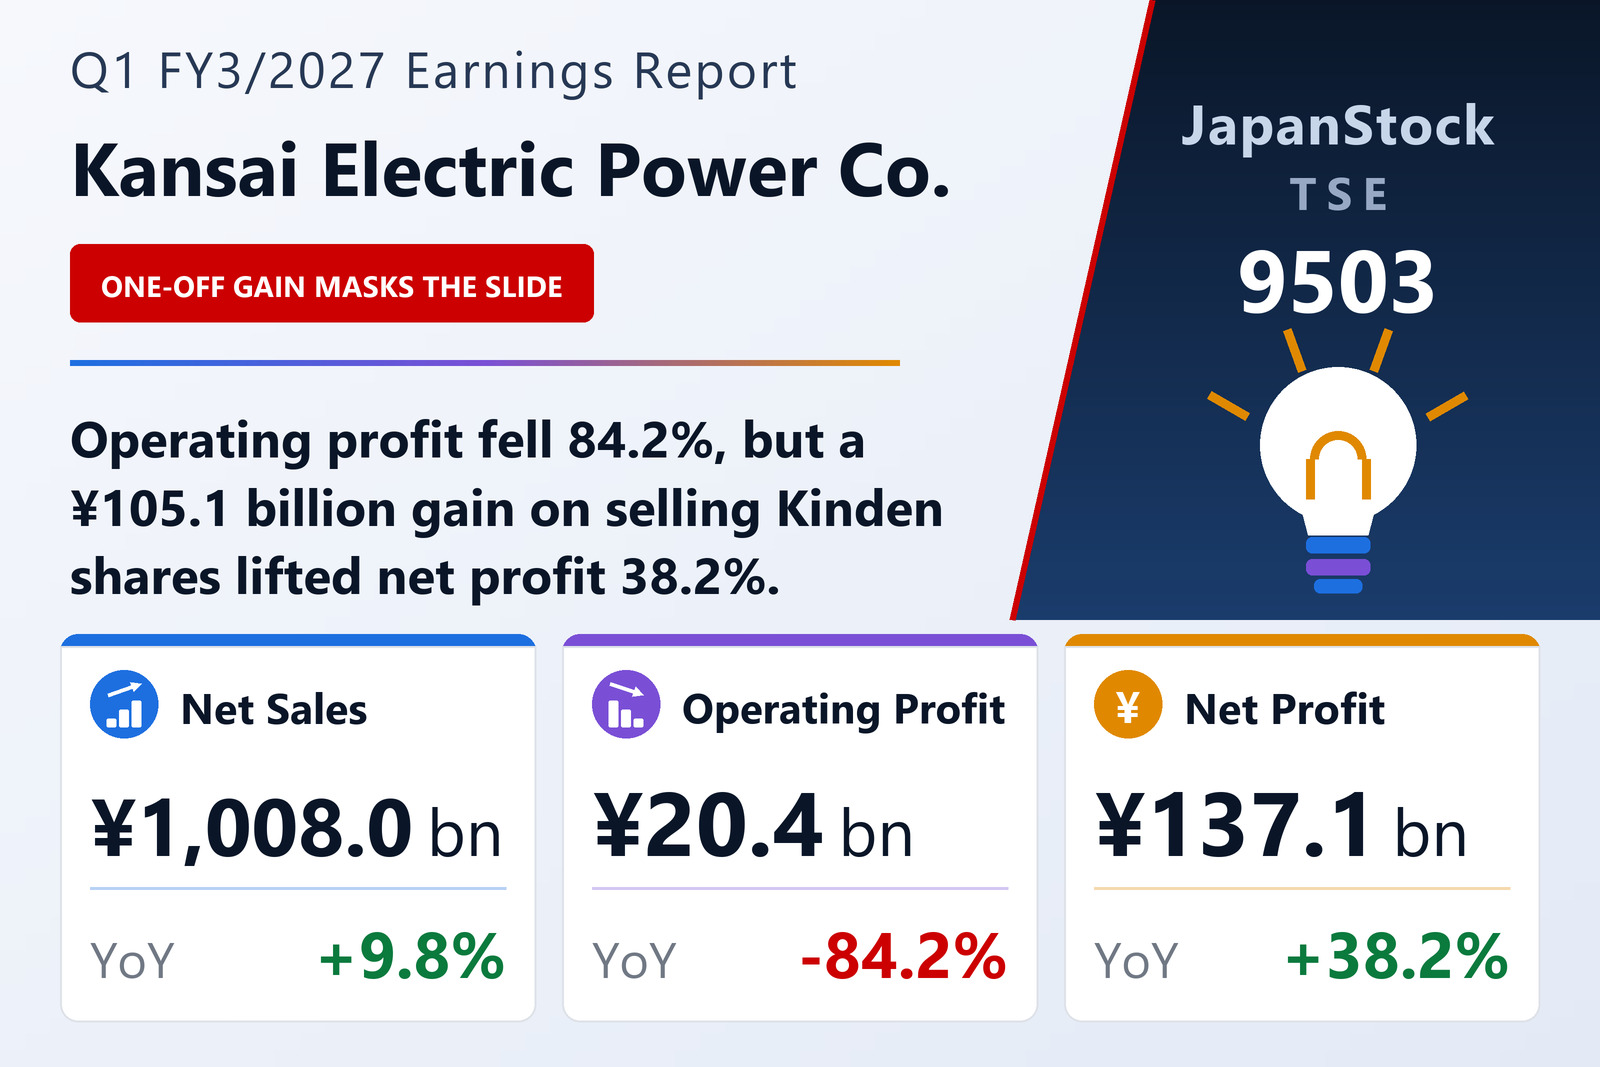
Revenue rose 9.8% to ¥1,007,962 million — past the ¥1 trillion mark for the quarter — reversing a 6.7% decline a year earlier. Operating profit then fell 84.2% to ¥20,371 million from ¥128,949 million, taking the operating margin down to 2.0% from 14.0%. Ordinary profit fell 60.8% to ¥52,822 million, a smaller decline than operating profit, so non-operating items cushioned part of the fall.
Below that, the direction inverts. Net profit attributable to owners of the parent rose 38.2% to ¥137,061 million against ¥99,163 million — a net profit more than six times the operating profit. Earnings per share reached ¥123.02 against ¥89.01, and comprehensive income more than doubled, up 111.4% to ¥163,886 million.
The ¥105 billion line that explains it
The gap between an 84.2% fall in operating profit and a 38.2% rise in net profit is a single extraordinary item. Kansai Electric and its wholly-owned subsidiary Kanden Realty & Development tendered part of their holdings into a tender offer by Kinden Corporation for its own shares. Kinden is an equity-method affiliate of Kansai Electric, and the partial sale produced a gain on sale of affiliate shares of ¥105,077 million, booked as an extraordinary gain.
Strip that out and the quarter reads very differently: ordinary profit of ¥52,822 million against ¥134,672 million a year earlier. Investors comparing this quarter with the last should note that the ¥105,077 million is a one-time disposal gain and does not recur.
Balance sheet, dividend and unchanged guidance
Total assets fell 0.4% to ¥9,818,922 million from the March 31, 2026 year-end, while net assets rose 3.2% to ¥3,616,331 million on the quarter's profit — lifting the equity ratio to 36.3% from 35.1%. The annual dividend forecast is ¥80.00, split ¥40.00 interim and ¥40.00 year-end, up from ¥75.00 paid for FY3/2026 (¥30.00 interim plus ¥45.00 year-end).
Full-year FY3/2027 guidance was left unchanged: revenue of ¥4,500,000 million (+10.9%), operating profit of ¥250,000 million (−42.9%), ordinary profit of ¥290,000 million (−44.1%) and net profit of ¥310,000 million (−18.4%), for earnings per share of ¥278.23. The shape is unusual and worth stating plainly: management already expects operating profit to fall 42.9% across the year, and with only ¥20,371 million booked in the first quarter — 8.1% of the ¥250,000 million target — the remaining three quarters carry almost all of it. Net profit, by contrast, is already 44.2% of the way to its full-year figure, because the Kinden gain landed in the first quarter.
| Metric | Q1 FY3/2027 | Q1 FY3/2026 | Change |
|---|---|---|---|
| Net sales (¥ million) | 1,007,962 | 917,791 | +9.8% |
| Operating profit (¥ million) | 20,371 | 128,949 | -84.2% |
| Operating margin | 2.0% | 14.0% | -12.0 pt |
| Ordinary profit (¥ million) | 52,822 | 134,672 | -60.8% |
| Extraordinary gain — sale of affiliate shares (¥ million) | 105,077 | — | new |
| Net profit attrib. to owners of parent (¥ million) | 137,061 | 99,163 | +38.2% |
| Comprehensive income (¥ million) | 163,886 | 77,536 | +111.4% |
| EPS (¥) | 123.02 | 89.01 | +38.2% |
| Total assets (¥ million) | 9,818,922 | 9,854,646 | -0.4% |
| Net assets (¥ million) | 3,616,331 | 3,502,744 | +3.2% |
| Equity ratio | 36.3% | 35.1% | +1.2 pt |
| FY3/2027 guidance — revenue (¥ million) | 4,500,000 | — | +10.9% |
| FY3/2027 guidance — operating profit (¥ million) | 250,000 | — | -42.9% |
| FY3/2027 guidance — ordinary profit (¥ million) | 290,000 | — | -44.1% |
| FY3/2027 guidance — net profit (¥ million) | 310,000 | — | -18.4% |
| FY3/2027 guidance — EPS (¥) | 278.23 | — | — |
| Annual dividend per share (¥) | 80.00 | 75.00 | +6.7% |
JapanStockPulse provides informational content only and does not constitute investment advice. Figures are taken from the company's published earnings short report and may be subject to subsequent revision.