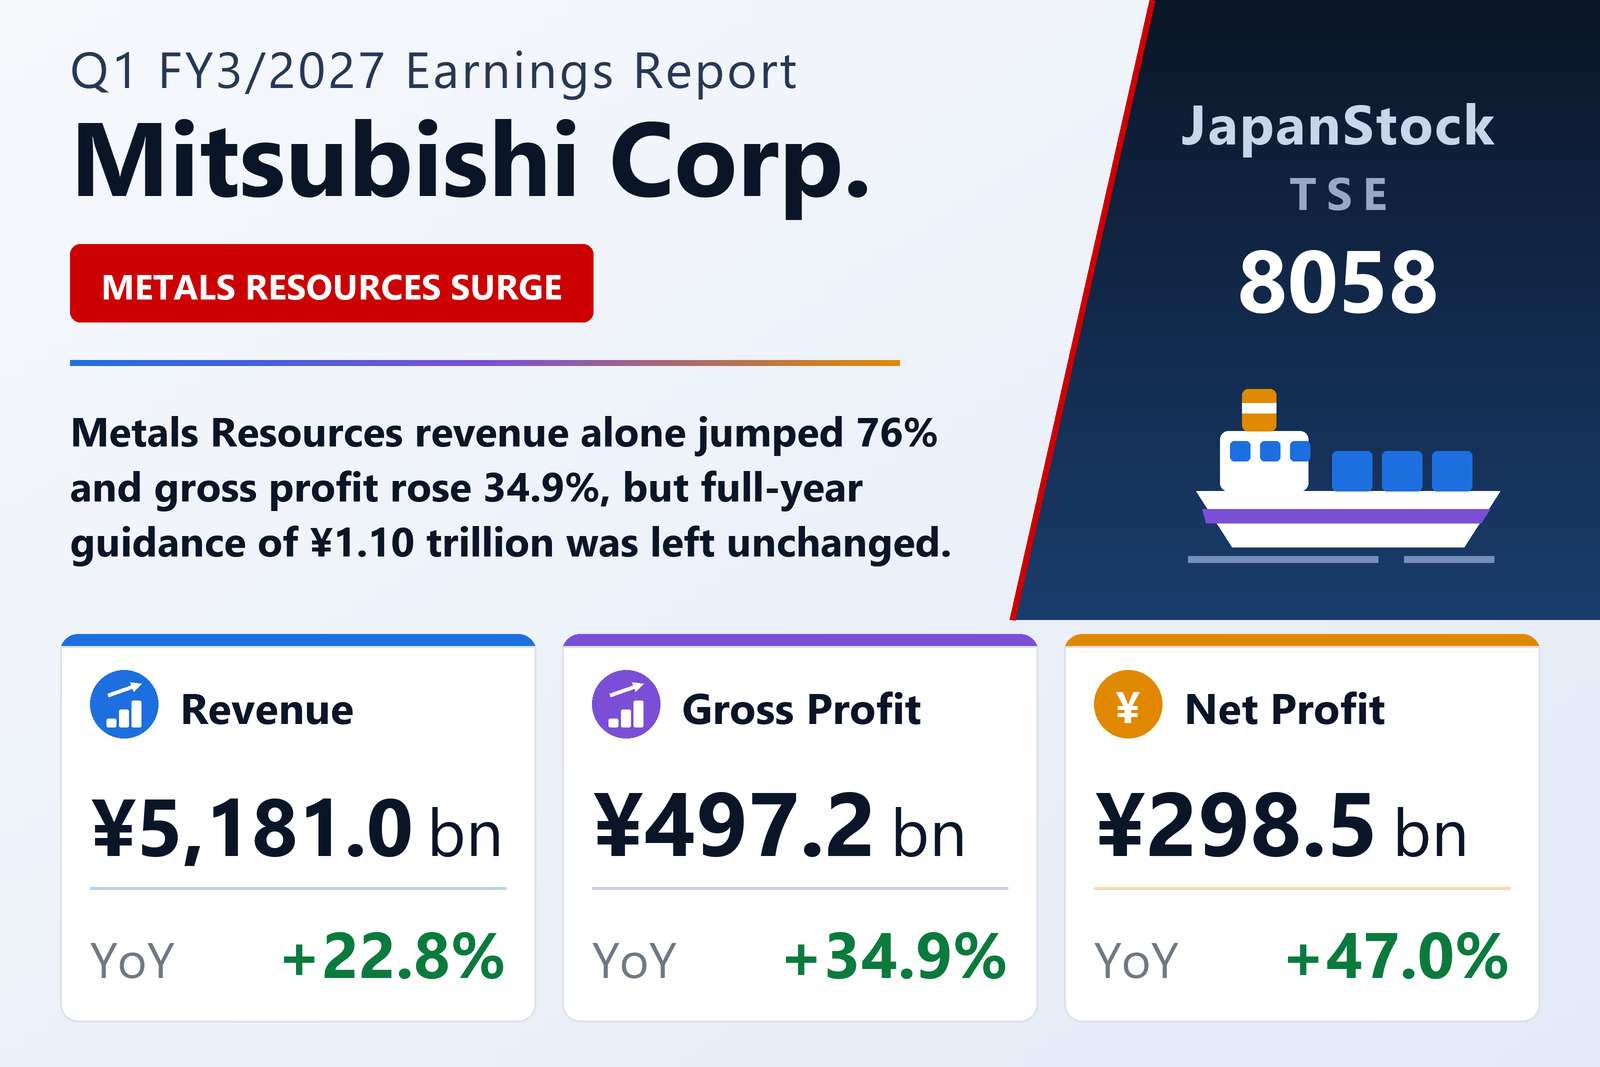
Mitsubishi Corporation (TSE: 8058), Japan's largest general trading house by revenue, reported consolidated first-quarter results for the three months to June 30, 2026 under IFRS. Revenue rose 22.8% to ¥5,180,999 million, profit before tax climbed 53.4% to ¥388,009 million, and profit attributable to owners of the parent rose 47.0% to ¥298,524 million from ¥203,121 million. Basic earnings per share reached ¥81.53 against ¥51.59, and comprehensive income attributable to owners more than quadrupled to ¥445,314 million from ¥101,414 million.
Commodity prices do the heavy lifting
The quarter's engine was price, not volume mix. Gross profit expanded 34.9% to ¥497,158 million from ¥368,451 million, a ¥128.7 billion gain the company attributes squarely to firmer market prices across its resource businesses. Selling, general and administrative expenses grew to ¥346.8 billion from ¥290.5 billion, held up by yen weakness translating overseas costs and a larger provision for doubtful accounts. Equity in earnings of affiliates added ¥150,880 million, up 8.8% from ¥138,718 million. Below that, net financial income improved to ¥95.0 billion from ¥60.1 billion on higher dividends from resource investees, partly offset by financial expenses of ¥51.5 billion against ¥40.8 billion as bond and loan balances grew. Gains on securities rose to ¥25.4 billion and the disposal line swung to a ¥5.8 billion gain from a ¥3.7 billion loss, helped by an Australian coking-coal transaction. A heavier tax charge of ¥73.7 billion against ¥32.3 billion trimmed, but did not derail, the result.
Metals Resources drives the segment scorecard
Mitsubishi reorganised into seven business groups this fiscal year and has restated the comparative period accordingly. On that basis Metals Resources was the standout, with revenue up 76.0% to ¥1,396,195 million and segment profit of ¥86,582 million — the largest single contribution of the quarter. Energy & Power Solutions followed at ¥71,934 million on revenue up 6.7%, while Food Industry contributed ¥36,208 million on revenue up 23.0%, helped by a litigation settlement received at Mitsubishi Shokuhin. Mobility grew revenue 28.3% and delivered ¥31,216 million, Social Infrastructure ¥29,610 million despite a 2.5% revenue dip, S.L.C. ¥20,481 million, and Materials Solutions ¥17,801 million. The seven segments together produced ¥293,832 million, with a further ¥4,692 million from other items and adjustments.
| Segment | Revenue (¥ billion) | Revenue YoY | Profit attributable to owners (¥ billion) |
|---|---|---|---|
| Energy & Power Solutions | 1,061.8 | +6.7% | 71.9 |
| Materials Solutions | 979.4 | +12.4% | 17.8 |
| Metals Resources | 1,396.2 | +76.0% | 86.6 |
| Social Infrastructure | 195.9 | -2.5% | 29.6 |
| Mobility | 252.1 | +28.3% | 31.2 |
| Food Industry | 671.3 | +23.0% | 36.2 |
| S.L.C. | 621.6 | +1.4% | 20.5 |
| Other & adjustments | 2.5 | — | 4.7 |
| Total | 5,181.0 | +22.8% | 298.5 |
Chiyoda leaves the consolidation and the balance sheet shrinks
The single largest structural change of the quarter was the removal of Chiyoda Corporation from the consolidated group; the engineering contractor now sits in the accounts as an equity-method affiliate, and the re-measurement produced a gain that helped offset the absence of last year's TH Foods disposal profit. Its departure is also why total assets fell to ¥23,449,799 million from ¥24,151,695 million at March 31, 2026, with current assets down ¥726.7 billion on lower trade and other receivables — a mix of the deconsolidation and normal seasonality. Total liabilities dropped to ¥13,085.0 billion from ¥13,901.1 billion. Equity moved the other way: total equity rose to ¥10,364,799 million and equity attributable to owners to ¥9,635,220 million from ¥9,440,567 million, lifted by ¥194.7 billion of positive currency-translation adjustments on overseas operations. With a smaller asset base and a larger equity base, the ratio of equity attributable to owners jumped to 41.1% from 39.1%. Net interest-bearing debt excluding lease liabilities edged up to ¥3,939.8 billion from ¥3,888.2 billion.
Cash generation swings sharply positive
Operating cash flow quadrupled to ¥431.8 billion from ¥108.2 billion, which the company credits to a lighter working-capital burden and higher operating receipts alongside dividend income. Investing outflows widened to ¥246.5 billion from ¥189.5 billion — loan recoveries and asset sales were more than absorbed by the cash that left with Chiyoda, plus new commitments in European integrated energy, Australian coking coal, a US data-centre project and salmon farming. Even so, free cash flow turned positive at ¥185.3 billion against an outflow of ¥81.3 billion a year earlier. Financing consumed ¥323.5 billion versus ¥106.9 billion, reflecting dividend payments and bond and loan repayments. Cash and equivalents ended the quarter at ¥1,720,747 million, down ¥120.7 billion from the March year-end. Mitsubishi also publishes an "operating income cash flow" measure that strips out working-capital swings and deducts lease payments; that figure rose to ¥341.2 billion from ¥250.4 billion.
Guidance held, dividend raised, share count down 8%
Full-year guidance is unchanged from the May 1, 2026 announcement: profit attributable to owners of ¥1,100,000 million, up 37.4%, with basic earnings per share of ¥300.42. The first quarter's ¥298.5 billion represents 27.1% of that target. The dividend forecast is likewise unrevised but materially higher year on year — ¥125.00 per share for FY3/2027, split between a ¥62.00 interim and a ¥63.00 year-end payment, against ¥110.00 paid for FY3/2026. Behind the per-share figures sits a shrinking denominator: shares issued fell to 3,710,528,742 from 4,028,926,353, a reduction of roughly 318 million shares or 7.9%, following the company's buyback and cancellation programme. Accounting policies were unchanged, and the company reiterated that its forecasts rest on current information and are not a promise of delivery.
| Metric | Q1 FY3/2027 | Q1 FY3/2026 | YoY |
|---|---|---|---|
| Revenue (¥ billion) | 5,181.00 | 4,218.71 | +22.8% |
| Gross profit (¥ billion) | 497.16 | 368.45 | +34.9% |
| Equity in earnings of affiliates (¥ billion) | 150.88 | 138.72 | +8.8% |
| Profit before tax (¥ billion) | 388.01 | 252.92 | +53.4% |
| Profit for the quarter (¥ billion) | 314.35 | 220.63 | +42.5% |
| Profit attributable to owners (¥ billion) | 298.52 | 203.12 | +47.0% |
| Comprehensive income (¥ billion) | 445.31 | 101.41 | +339.1% |
| Basic EPS (¥) | 81.53 | 51.59 | +58.0% |
| Operating cash flow (¥ billion) | 431.8 | 108.2 | +299.1% |
| Free cash flow (¥ billion) | 185.3 | -81.3 | turned positive |
| Total assets (¥ billion) | 23,449.80 | 24,151.70 | -2.9% |
| Equity attributable to owners (¥ billion) | 9,635.22 | 9,440.57 | +2.1% |
| Ratio of equity attributable to owners (%) | 41.1 | 39.1 | +2.0pt |
| Annual dividend per share (¥) | 125.00 | 110.00 | +13.6% |
| FY3/2027 guidance — profit attributable (¥ billion) | 1,100.00 | — | +37.4% |
JapanStockPulse provides informational content only and does not constitute investment advice. Figures are taken from the company’s published earnings short report and may be subject to subsequent revision.