A ¥28.8 billion swing at the operating line
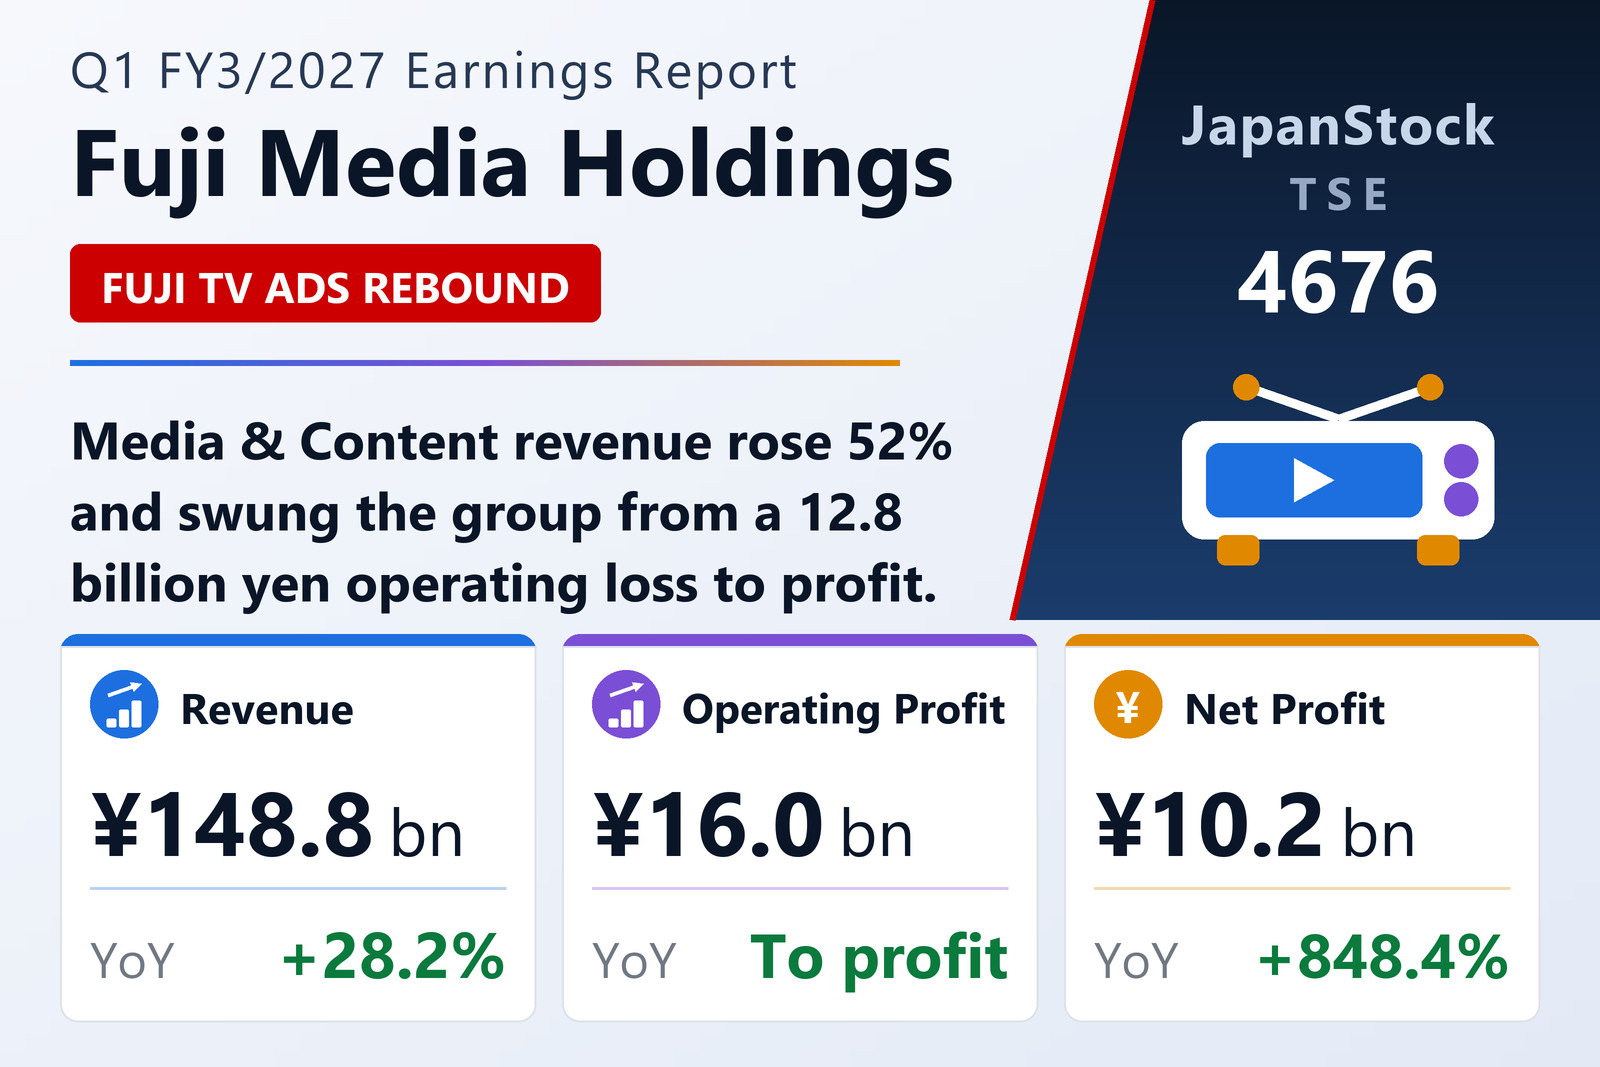
Fuji Media Holdings, Inc. (TSE: 4676) published consolidated results for the three months to June 30, 2026 on August 4, 2026 under Japanese GAAP. Net sales rose 28.2% to ¥148,840 million. Operating profit came in at ¥16,025 million against a ¥12,779 million loss a year earlier, an improvement of ¥28,805 million, and ordinary profit at ¥17,364 million against a ¥10,656 million loss, an improvement of ¥28,021 million.
Net profit attributable to shareholders rose 848.4% to ¥10,218 million, an increase of ¥9,140 million — a smaller step up than the lines above it because the prior year carried gains on the sale of investment securities that did not repeat. Earnings per share were ¥71.74 against ¥5.19. Comprehensive income turned positive at ¥7,327 million after a ¥6,693 million loss.
Fuji Television back in the black
Media & Content lifted revenue 52.4% to ¥101,659 million and swung to a segment profit of ¥9,018 million from a ¥20,396 million loss, an improvement of ¥29,414 million. At Fuji Television, terrestrial advertising recovered sharply from the previous year's slump following the company's affair, with network time, local time and spot all higher, and streaming advertising also grew. Content business revenue rose as FOD subscription income and distribution-rights sales lifted the digital business and royalty income lifted the animation business, more than covering weaker event revenue.
Elsewhere in the segment, BS Fuji grew both time and spot revenue; Nippon Broadcasting grew on strong radio time sales and events, with a better broadcast cost ratio; and Pony Canyon returned to an operating profit on overseas sales of animation titles and higher music and video streaming, helped by a lighter cost burden after animation production costs were written down at the end of last year. Fuji Pacific Music grew on core copyright royalties. Against that, the catalogue retailer dinos lost sales in TV and catalogue fashion despite strong furniture and living-goods demand, and the advertising agency Quaras saw revenue fall on the absence of last year's events even as TV and web advertising handling lifted its profit.
Property and hotels give some of it back
Urban Development & Tourism revenue fell 4.7% to ¥45,085 million and segment profit 11.0% to ¥7,443 million. Sankei Building grew revenue and profit, with office, rental-residential and hotel rents firm and sales of owned and development properties broadly on plan at about the same scale as last year. Grandvista Hotels & Resorts went backwards as inbound visitor numbers fell below the prior year and the Kansai Expo comparison turned against it, while price and labour costs rose; Sankei Building Techno also lapped a large construction project. The Other segment lifted revenue 3.2% to ¥6,710 million and profit 6.7% to ¥373 million.
Balance sheet, guidance and dividend
Total assets slipped 0.7% to ¥1,454,158 million and net assets 1.3% to ¥554,139 million, leaving the equity ratio at 37.1% against 37.3% at the March year-end. Shareholders' equity was ¥539,255 million against ¥546,719 million.
Fuji Media left the guidance published on May 12, 2026 unchanged: full-year net sales of ¥625,700 million (+13.4%), operating profit of ¥40,100 million and ordinary profit of ¥38,300 million — both against year-earlier losses — and net profit of ¥26,100 million (+301.6%), for earnings per share of ¥183.23. The first quarter has therefore already delivered 40.0% of the full-year operating-profit target. Management notes that the guidance does not assume the introduction of external capital into the urban development and tourism business, a review of which it announced on February 3, 2026 and whose method, timing and scale remain undecided. The annual dividend forecast is ¥200.00 against ¥125.00 last year, split ¥100.00 and ¥100.00.
| Metric | Q1 FY3/2027 | Q1 FY3/2026 | Change |
|---|---|---|---|
| Net sales (¥ million) | 148,840 | 116,140 | +28.2% |
| Operating profit (¥ million) | 16,025 | -12,779 | loss to profit |
| Ordinary profit (¥ million) | 17,364 | -10,656 | loss to profit |
| Net profit attrib. to owners of parent (¥ million) | 10,218 | 1,077 | +848.4% |
| Comprehensive income (¥ million) | 7,327 | -6,693 | loss to profit |
| EPS (¥) | 71.74 | 5.19 | +1,282.3% |
| Media & Content — revenue (¥ million) | 101,659 | 66,710 | +52.4% |
| Media & Content — segment profit (¥ million) | 9,018 | -20,396 | loss to profit |
| Urban Development & Tourism — revenue (¥ million) | 45,085 | 47,297 | -4.7% |
| Urban Development & Tourism — segment profit (¥ million) | 7,443 | 8,366 | -11.0% |
| Other — revenue (¥ million) | 6,710 | 6,504 | +3.2% |
| Other — segment profit (¥ million) | 373 | 349 | +6.7% |
| Total assets (¥ million) | 1,454,158 | 1,464,728 | -0.7% |
| Net assets (¥ million) | 554,139 | 561,467 | -1.3% |
| Equity ratio | 37.1% | 37.3% | -0.2 pt |
| FY3/2027 guidance — revenue (¥ million) | 625,700 | — | +13.4% |
| FY3/2027 guidance — operating profit (¥ million) | 40,100 | — | loss to profit |
| FY3/2027 guidance — ordinary profit (¥ million) | 38,300 | — | loss to profit |
| FY3/2027 guidance — net profit (¥ million) | 26,100 | — | +301.6% |
| FY3/2027 guidance — EPS (¥) | 183.23 | — | — |
| Annual dividend per share (¥) | 200.00 | 125.00 | +60.0% |
JapanStockPulse provides informational content only and does not constitute investment advice. Figures are taken from the company's published earnings short report and may be subject to subsequent revision.