A doubled bottom line — on a comparison base that has been rebuilt
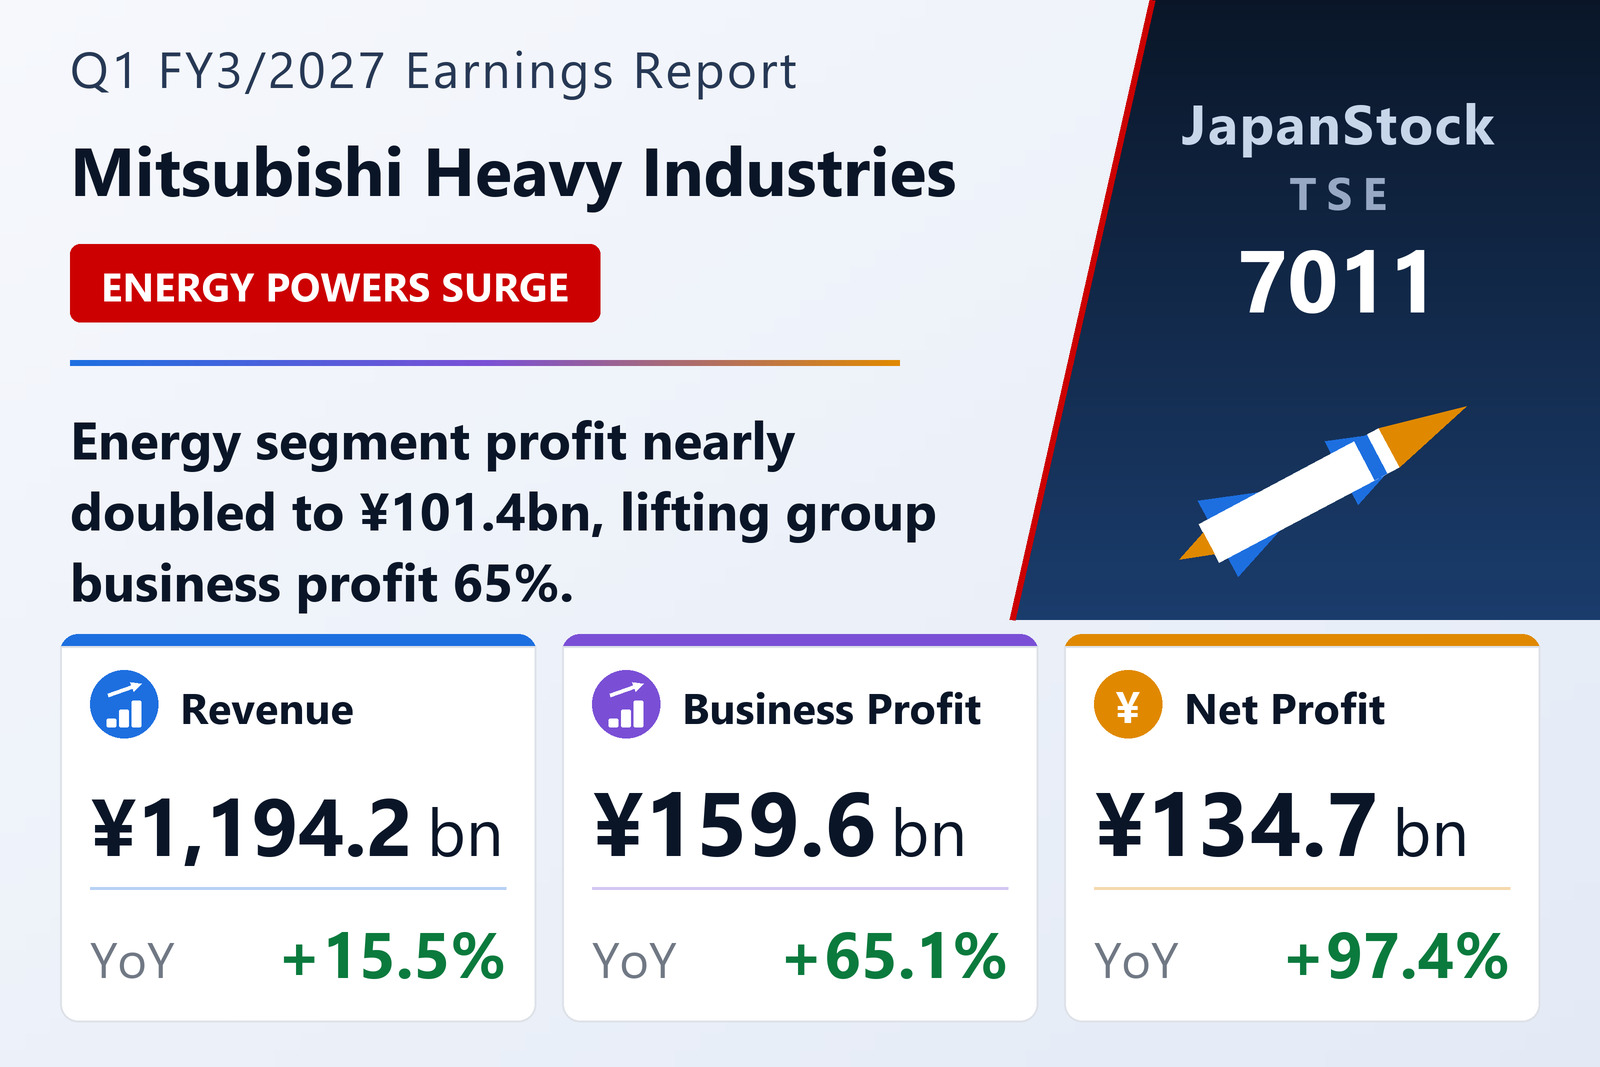
Mitsubishi Heavy Industries, Ltd. (TSE: 7011), Japan's largest heavy-engineering group and a company listed on the Tokyo, Nagoya, Sapporo and Fukuoka exchanges, published its first-quarter results for the year to March 2027 on August 4, 2026, under IFRS. For the three months from April 1 to June 30, 2026, the group led by President Eisaku Ito reported revenue of ¥1,194,203 million against ¥1,034,109 million a year earlier, business profit of ¥159,645 million against ¥96,690 million, profit before tax of ¥176,426 million against ¥88,663 million, and profit attributable to owners of the parent of ¥134,680 million against ¥68,227 million. Basic earnings per share came in at ¥40.08, up 97.2% from ¥20.32, with diluted EPS of ¥40.07.
Those comparisons need a caveat that the company itself is careful to make. Two structural changes landed at the start of this financial year. First, effective April 1, 2026, MHI re-cut its four reporting segments: what used to be Energy / Plants & Infrastructure Systems / Logistics, Thermal & Drive Systems / Aircraft, Defense & Space is now Energy / Plants & Infrastructure Systems / Industrial Solutions / Aircraft, Defense & Space. Second, and more consequentially for the arithmetic, the business of Mitsubishi Logisnext Co., Ltd. — now Logisnext Co., Ltd. — together with its subsidiaries and affiliates was classified as discontinued operations beginning in the prior interim period.
The practical effect is that revenue, business profit and profit before tax are now stated on a continuing-operations basis only, while profit for the period, profit attributable to owners and comprehensive income combine continuing and discontinued operations. Prior-year figures have been restated on the same basis. That is precisely why the company does not publish year-on-year percentage changes for revenue, business profit or profit before tax in its own summary table — the percentages quoted throughout this article for those three lines are computed by JapanStockPulse from the restated comparatives shown in the release, and should be read as such rather than as figures the company has itself asserted. Separately, the previously unallocated Data Center & Energy Management business was folded into a reporting segment through an internal group reorganisation, with prior-period segment information restated accordingly. Readers reconciling EPS will note that the ¥40.08 basic figure splits into ¥38.45 from continuing operations and ¥1.62 from discontinued operations, against ¥19.45 and ¥0.86 respectively a year earlier, with the ¥0.01 difference from rounding.
Underneath the restatement, the operating improvement is real and broadly based. Gross profit rose 23.1% to ¥279,697 million on cost of sales that grew more slowly than revenue, at 13.3%, lifting the gross margin to 23.4% from 22.0%. Selling, general and administrative expenses rose only 5.8% to ¥152,799 million — well below the 15.5% revenue advance — so the SG&A burden fell to 12.8% of revenue from 14.0%. Equity-method investment income more than doubled to ¥9,090 million from ¥3,430 million, and other income rose to ¥28,728 million from ¥15,460 million against other expenses of just ¥5,070 million. The business-profit margin, on the company's own definition of that measure, widened to 13.4% from 9.3%.
One line below business profit deserves particular attention, because it accounts for the gap between a 65.1% rise in business profit and a 99.0% rise in profit before tax. Finance income jumped to ¥20,476 million from ¥3,825 million while finance costs fell to ¥3,695 million from ¥11,852 million — a net financial result that swung from a ¥8,027 million charge to a ¥16,781 million credit, a movement of ¥24,808 million. Add that swing to the ¥62,955 million increase in business profit and the ¥87,763 million increase in profit before tax is fully explained. Income tax expense of ¥44,863 million represented an effective rate of 25.4%, up from 24.5%, and discontinued operations added ¥6,580 million of profit against ¥4,508 million. Comprehensive income of ¥131,916 million was 86.6% higher, a striking reversal given that the comparable prior-year figure had itself fallen 49.6%.
Energy is the engine — and it is doing most of the work
The single most important fact in this release is the concentration of the improvement. Energy — the segment covering thermal power (gas turbine combined cycle, or GTCC, and steam power), nuclear power (light-water reactors, the nuclear fuel cycle and new fields), aero engines, compressors and marine machinery — grew total revenue including inter-segment sales 26.7% to ¥536,390 million from ¥423,222 million, with external revenue of ¥535,148 million. Segment profit, presented as business profit, rose 79.8% to ¥101,397 million from ¥56,402 million, taking the segment's margin to 18.9% from 13.3%.
Put those numbers next to the group totals and the dependency becomes stark. Energy generated 44.7% of reportable-segment revenue but 61.3% of reportable-segment profit (¥101,397 million of the ¥165,497 million total, before the ¥18,679 million of corporate costs and eliminations that sit outside the segments). More pointedly still, of the ¥57,692 million by which reportable-segment profit grew year on year, Energy supplied ¥44,995 million — roughly 78% of the entire increase. Strip Energy out and the rest of Mitsubishi Heavy grew segment profit by about 25%: a good quarter, but not the one the headline describes.
That concentration is the natural consequence of where global capital spending is going. Gas turbines and the GTCC plants built around them are the equipment of choice for the power capacity now being ordered to serve data centres and to firm up intermittent renewables, and MHI is one of a very small group of manufacturers able to supply them at scale. Nuclear, the segment's other pillar, spans reactor service work and the fuel cycle. The release does not break out order intake or a regional split, so the durability of the surge cannot be judged from this document alone — but the balance-sheet movements discussed below give an indirect signal.
The other three segments: one shrinking, one transformed, one steady
Plants & Infrastructure Systems was the only segment whose top line went backwards: revenue fell 3.8% to ¥200,009 million from ¥207,943 million, with external revenue of ¥192,028 million. Profitability nonetheless improved markedly, with segment profit up 17.1% to ¥21,719 million and the margin widening to 10.9% from 8.9%. This is the segment housing machinery systems — paper converting machinery, intelligent transport systems and testing equipment among other lines — and the combination of lower revenue with higher profit points to mix and execution rather than volume.
Industrial Solutions, the newly constituted segment, produced the largest percentage improvement anywhere in the group: revenue up 15.1% to ¥177,902 million and segment profit up 146.3% to ¥9,951 million from ¥4,040 million, lifting the margin to 5.6% from 2.6%. It remains, on that margin, the least profitable of the four reporting segments by a wide distance, so the near-tripling of profit is best read as a low base recovering rather than as a new profit engine. It is also the segment most directly affected by the reorganisation — it is what remains after the forklift business moved to discontinued operations — so its comparatives are the least intuitive in the set.
Aircraft, Defense & Space, the segment that has drawn most investor attention over the past two years on the strength of Japan's defence build-up, delivered solid rather than spectacular growth: revenue up 9.8% to ¥286,070 million and segment profit up 12.5% to ¥32,428 million, with the margin essentially flat at 11.3% against 11.1%. It spans commercial aircraft, defence aircraft, missiles, naval vessels, special-purpose machinery including torpedoes, special vehicles and space. On revenue it is now the group's second-largest segment, and its steadiness is a useful counterweight to the volatility that Energy's swing implies. The Other category contributed revenue of ¥1,799 million and profit of ¥12,827 million against ¥7,549 million, while corporate items and eliminations carried negative revenue of ¥7,969 million and a negative profit of ¥18,679 million — essentially unchanged from ¥18,664 million a year earlier — reflecting group-wide research and development and dividends on shares held for the business as a whole.
A smaller balance sheet carrying a much larger customer float
Total assets fell 1.4% to ¥8,151,335 million from ¥8,269,711 million at March 31, 2026, and total liabilities fell ¥129,550 million to ¥4,911,760 million, of which current liabilities were ¥4,195,358 million and non-current liabilities ¥716,401 million. A shrinking balance sheet alongside a doubling of profit is unusual, and the composition explains it.
The most consequential single movement is in contract liabilities, which rose ¥321,340 million to ¥2,483,221 million from ¥2,161,881 million in three months. Contract liabilities are advance payments received from customers against work not yet recognised as revenue — in a business that builds power plants, ships and defence systems to order, they are the cash face of an order book. A ¥321 billion increase in a single quarter, on a base of ¥2.16 trillion, is the strongest evidence in this release that demand is running ahead of delivery, and it is what funds the group's working capital: inventories rose ¥112,982 million to ¥1,154,881 million and contract assets ¥51,140 million to ¥1,070,336 million, both consistent with a widening production pipeline. Property, plant and equipment was little changed at ¥798,607 million, and goodwill edged up to ¥107,159 million.
Equity tells the story of the Logisnext exit. Total equity rose only ¥11,175 million to ¥3,239,575 million, but equity attributable to owners of the parent rose ¥82,669 million to ¥3,171,235 million while non-controlling interests fell ¥71,495 million to ¥68,339 million from ¥139,834 million — a halving that is consistent with the deconsolidation of a partly owned subsidiary group. The assets held for sale of ¥21,350 million carried on the March 2026 balance sheet are now nil. The net effect on the metric shareholders watch is favourable: the owners' equity ratio improved 1.6 points to 38.9% from 37.3%, the parent's own capital now standing higher against a smaller asset base.
The dividend steps up 16%
Mitsubishi Heavy paid ¥25.00 per share for the year to March 2026 — ¥12.00 at the interim stage and ¥13.00 at the year end. For the year to March 2027 it forecasts ¥14.00 interim and ¥15.00 year-end, for an annual ¥29.00, a 16.0% increase. That forecast is unrevised from the previously announced figure; the quarter's outperformance has not, at this stage, been passed through to shareholders in the form of a raise. Against the guided full-year EPS of ¥113.09 the annual dividend implies a payout ratio of roughly 25.6%.
The share count barely moved. Shares issued including treasury stock were unchanged at 3,373,647,810, while treasury shares fell to 12,985,995 from 13,438,470, and the average number of shares used for the quarter's EPS calculation edged up to 3,360,575,080 from 3,358,271,260. Per-share growth of 97.2% therefore tracks attributable-profit growth of 97.4% almost exactly — there is no buyback flattering the earnings-per-share line in this quarter.
Guidance untouched after a quarter that ran well ahead of the run rate
Full-year guidance for the year to March 2027 is unchanged from the previous announcement: revenue of ¥5,400,000 million (+8.6%), business profit of ¥540,000 million (+24.9%), profit before tax of ¥530,000 million (+11.7%) and profit attributable to owners of the parent of ¥380,000 million (+14.4%), for EPS of ¥113.09.
Measured against those targets, the first quarter delivered 22.1% of guided revenue, 29.6% of guided business profit and 35.4% of guided profit attributable to owners. A straight-line quarter would be 25% of each. Revenue is therefore running slightly behind the pace implied by guidance while both profit lines are running conspicuously ahead — and the profit gap is the wider of the two by a considerable margin. Leaving the forecast untouched in that situation is itself the notable decision in this release.
The arithmetic of what guidance now implies for the remaining nine months is worth stating plainly. Achieving exactly ¥540,000 million of business profit for the year requires ¥380,355 million over the balance of the year on ¥4,205,797 million of revenue — a margin of about 9.0%, against the 13.4% just delivered. Guidance, in other words, embeds a material narrowing of margin from the first-quarter level, whether because management expects the Energy mix to normalise, because cost pressure is anticipated, or simply because the company is choosing to be conservative one quarter into the year. Nothing in the release attributes the choice to any particular cause: no management commentary or order-intake data accompanies the summary figures.
Two housekeeping points close the statement. There was no significant change in the scope of consolidation during the quarter and no changes in accounting policies or estimates. And, as is standard for a Japanese first-quarter filing, the attached quarterly consolidated financial statements are not subject to review by a certified public accountant or an audit firm. The company prepared supplementary explanatory materials and held an earnings briefing for institutional investors, analysts and the media.
| Metric | Q1 FY3/2027 | Q1 FY3/2026 | Change |
|---|---|---|---|
| Revenue (¥ million) | 1,194,203 | 1,034,109 | +15.5% |
| Business profit (¥ million) | 159,645 | 96,690 | +65.1% |
| Profit before tax (¥ million) | 176,426 | 88,663 | +99.0% |
| Profit for the period (¥ million) | 138,143 | 71,425 | +93.4% |
| Profit attrib. to owners of parent (¥ million) | 134,680 | 68,227 | +97.4% |
| Comprehensive income (¥ million) | 131,916 | 70,709 | +86.6% |
| Basic EPS (¥) | 40.08 | 20.32 | +97.2% |
| Diluted EPS (¥) | 40.07 | 20.31 | +97.3% |
| Segment profit — Energy (¥ million) | 101,397 | 56,402 | +79.8% |
| Segment profit — Plants & Infrastructure Systems (¥ million) | 21,719 | 18,550 | +17.1% |
| Segment profit — Industrial Solutions (¥ million) | 9,951 | 4,040 | +146.3% |
| Segment profit — Aircraft, Defense & Space (¥ million) | 32,428 | 28,812 | +12.5% |
| Total assets (¥ million; vs Mar 31, 2026) | 8,151,335 | 8,269,711 | −1.4% |
| Equity attrib. to owners of parent (¥ million; vs Mar 31, 2026) | 3,171,235 | 3,088,566 | +2.7% |
| Owners' equity ratio (vs Mar 31, 2026) | 38.9% | 37.3% | +1.6 pt |
| Annual dividend per share, forecast (¥) | 29.00 | 25.00 | +16.0% |
JapanStockPulse provides informational content only and does not constitute investment advice. Figures are taken from the company's published earnings short report and may be subject to subsequent revision.