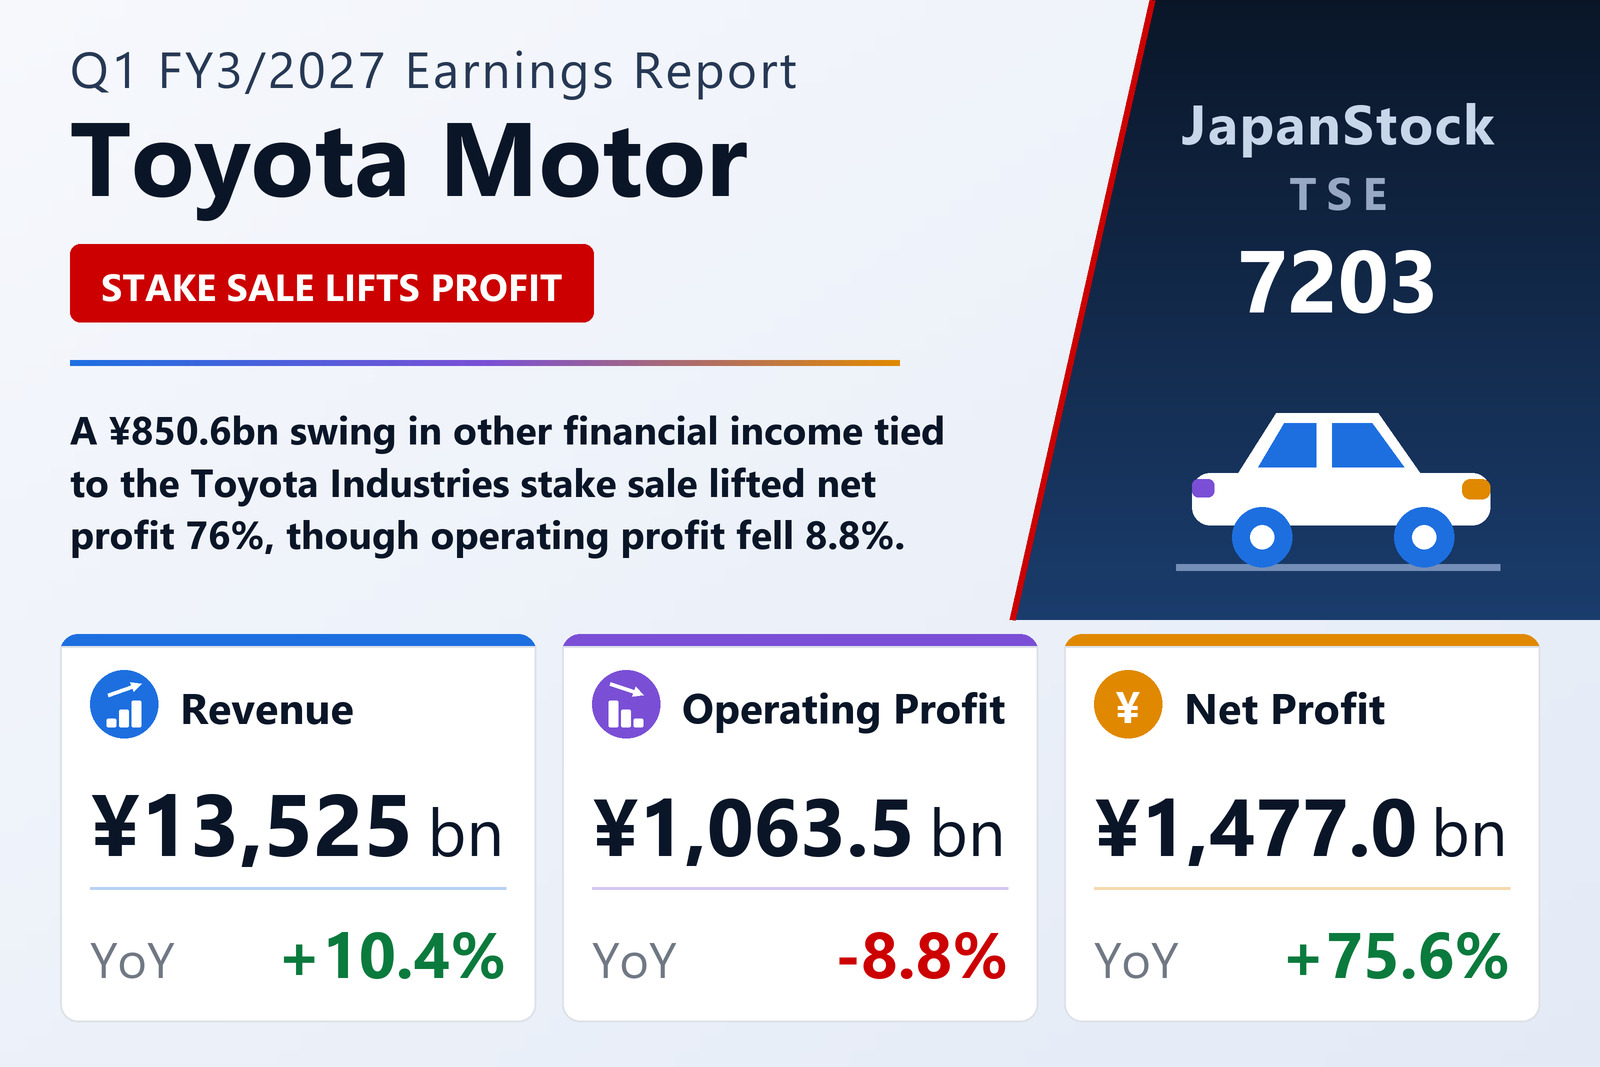
Toyota Motor Corporation (TSE: 7203), the world's largest carmaker by unit volume, reported consolidated first-quarter results for the three months to June 30, 2026 under IFRS. Revenue climbed 10.4% to ¥13,525,400 million, but operating profit slipped 8.8% to ¥1,063,473 million. Below the operating line the picture reversed completely: profit before tax leapt 56.8% to ¥1,963,862 million, quarterly profit rose 77.9% to ¥1,551,725 million, and profit attributable to owners of the parent surged 75.6% to ¥1,477,044 million. Basic earnings per share came in at ¥120.69 against ¥64.56 a year earlier — an 86.9% increase, well ahead of the profit growth itself, because the average share count shrank 6.1% to 12,238,756,596 shares after a very large buyback.
Operating profit slips despite a ¥345 billion currency tailwind
Toyota's own bridge for the ¥102.6 billion decline in operating profit shows how narrow the miss was. Marketing efforts added ¥70.0 billion and foreign exchange contributed ¥345.0 billion — the yen averaged ¥160 to the dollar in the quarter against ¥145 a year earlier, and ¥185 to the euro against ¥164. Working the other way, cost-reduction efforts were a negative ¥85.0 billion (design improvements −¥90.0 billion, partly offset by ¥5.0 billion from plants and logistics), the change in expenses cost ¥190.0 billion, and an "other" bucket removed a further ¥242.6 billion. The operating margin narrowed to 7.9% from 9.5%. Unlike the FY3/2026 full-year release, which isolated a ¥1.38 trillion hit from U.S. tariff policy, this quarterly report publishes no standalone tariff figure, so any residual tariff cost is not separable from the expense and "other" lines. Research and development spending rose to ¥383.2 billion from ¥355.8 billion, depreciation to ¥377.8 billion from ¥327.5 billion, and capital expenditure to ¥410.5 billion from ¥392.4 billion — all consistent with management's long-standing message that it is deliberately raising the break-even point to fund people and future technology.
Global vehicle sales edge lower as Japan offsets overseas
Consolidated vehicle sales totalled 2,395 thousand units, down 17 thousand or 0.7%. Japan was the bright spot at 524 thousand units, up 43 thousand or 8.9%, while overseas volume fell 60 thousand or 3.1% to 1,870 thousand units. Production rose 2.3% to 2,355 thousand units (Japan 1,023 thousand, overseas 1,332 thousand). By region, North America was essentially flat at 792 thousand units, Europe rose to 307 thousand from 298 thousand, Asia to 439 thousand from 421 thousand and Central & South America to 139 thousand from 129 thousand, while Oceania fell to 68 thousand from 78 thousand and the Middle East dropped sharply to 63 thousand from 147 thousand. One caveat matters for every one of those comparisons: FY3/2027 figures exclude Hino-brand vehicles, whereas the prior-year base included them, so the year-on-year moves are not fully like-for-like. Retail sales across the Toyota, Daihatsu and Hino brands were 2,714 thousand units against 2,829 thousand.
The Toyota Industries sale and the Hino exit rewrite the numbers below operating profit
The quarter's headline profit is a balance-sheet story, not a trading one. Other financial income exploded to ¥850,594 million from ¥153,721 million, a ¥696.9 billion increase that reflects the disposal of Toyota Industries shares. Partly offsetting, other financial expenses widened to ¥285,617 million from just ¥6,211 million, and net foreign exchange results swung to a ¥112,378 million gain from a ¥212,375 million loss. Equity-method income rose 49.4% to ¥210,685 million. In aggregate, non-operating items added ¥814.3 billion year on year, turning the ¥102.6 billion operating decline into a ¥711.7 billion increase in pre-tax profit; higher tax (¥412,136 million against ¥379,959 million) and a larger non-controlling-interest share together took back about ¥76.1 billion, leaving the ¥635.6 billion gain at the attributable line. Structurally, 70 companies — Hino Motors and its consolidated subsidiaries — left the consolidation scope following the Mitsubishi Fuso merger effective April 1, 2026, cutting the workforce to 367,990 from 390,927 at the March year-end. Separately, part of Toyota's holding in ARCHION Inc. was reclassified as held for sale ahead of a planned secondary offering; assets held for sale stood at ¥130,922 million at June 30 against ¥2,016,804 million at March 31, the earlier balance having been the Toyota Industries position now sold.
Segments: automotive down 21%, financial services up 24%
The Automotive segment grew revenue 8.8% to ¥12,012,773 million but saw operating profit fall 21.0% to ¥719,926 million, which Toyota attributes chiefly to higher expenses. Financial Services was the standout: revenue up 23.3% to ¥1,400,669 million and operating profit up 24.0% to ¥275,665 million on a larger loan portfolio — the segment now supplies roughly a quarter of group operating profit from a tenth of group revenue. All Other, which houses the information and telecommunications businesses, more than doubled operating profit to ¥81,679 million, up 118.0%, on revenue of ¥469,916 million (+37.0%). Intersegment eliminations and corporate items cost ¥13,796 million against ¥5,000 million a year earlier.
Regions: North America swings back into the black
The most consequential regional move was in North America, which posted operating profit of ¥185,475 million against a ¥21,164 million loss a year earlier — a ¥206.6 billion swing Toyota credits to lower expenses and cost-reduction work, on revenue up 14.9% to ¥6,105,783 million. Japan went the other way: revenue rose 11.8% to ¥5,824,588 million but operating profit fell 16.3% to ¥540,135 million on higher expenses. Europe improved 10.6% to ¥107,233 million on revenue up 20.4%, Asia eased 3.4% to ¥208,306 million, and other regions — Central and South America, Oceania, Africa and the Middle East — slipped 1.6% to ¥92,527 million. Eliminations and corporate items turned to a ¥70,203 million charge from a ¥135,497 million credit, the single largest regional-table swing after North America. Measured by customer location rather than by the location of the selling company, North America supplied ¥6,045,746 million of external revenue, Asia ¥1,998,731 million, Japan ¥1,922,090 million and Europe ¥1,798,376 million.
| Segment / region | Revenue Q1 FY3/27 (¥ billion) | Operating income Q1 FY3/27 (¥ billion) | Operating income Q1 FY3/26 (¥ billion) | YoY |
|---|---|---|---|---|
| Automotive (segment) | 12,012.77 | 719.93 | 911.42 | -21.0% |
| Financial Services (segment) | 1,400.67 | 275.67 | 222.26 | +24.0% |
| All Other (segment) | 469.92 | 81.68 | 37.47 | +118.0% |
| Segment eliminations & corporate | -357.96 | -13.80 | -5.00 | n.m. |
| Japan (region) | 5,824.59 | 540.14 | 645.06 | -16.3% |
| North America (region) | 6,105.78 | 185.48 | -21.16 | swing to profit |
| Europe (region) | 1,879.86 | 107.23 | 96.97 | +10.6% |
| Asia (region) | 2,336.32 | 208.31 | 215.73 | -3.4% |
| Other regions | 1,272.16 | 92.53 | 94.05 | -1.6% |
| Regional eliminations & corporate | -3,893.31 | -70.20 | 135.50 | n.m. |
| Consolidated | 13,525.40 | 1,063.47 | 1,166.14 | -8.8% |
Balance sheet and cash flow after a ¥3.66 trillion buyback
Toyota's balance sheet shrank for once. Total assets fell 2.7% to ¥102,635,116 million from ¥105,522,331 million at March 31, liabilities were essentially flat at ¥64,406,184 million (−0.1%), and total equity dropped 6.8% to ¥38,228,932 million. Equity attributable to owners of the parent fell to ¥37,308,828 million from ¥39,918,854 million and the equity ratio eased to 36.4% from 37.8%. The arithmetic is straightforward: ¥1,865,905 million of comprehensive income was more than consumed by ¥3,656,884 million of treasury-share purchases plus ¥651,697 million of parent dividends and ¥25,281 million to non-controlling interests. Toyota also cancelled ¥2,463,492 million of treasury stock, cutting shares issued by 1.2 billion to 14,594,987,460; treasury holdings stood at 2,753,153,800 shares. On the cash-flow statement, operating cash flow fell 71.4% to ¥536,551 million from ¥1,876,481 million, hit by a ¥1,431,911 million working-capital outflow and ¥829,435 million of income taxes paid. Investing swung to a ¥1,427,456 million inflow from a ¥1,802,002 million outflow, a ¥3,229.4 billion reversal driven by securities disposals, while financing consumed ¥4,339,099 million against ¥803,284 million. Cash and equivalents ended the quarter at ¥10,343,085 million, down 18.3% from ¥12,659,622 million.
Guidance raised across the board; dividend held at ¥100
Three months after guiding to a second consecutive profit decline, Toyota lifted every headline line of its FY3/2027 forecast. Revenue guidance rose to ¥54,000 billion (+6.5%) from the ¥51,000 billion set in May, operating profit to ¥3,400 billion (−9.7%) from ¥3,000 billion, pre-tax profit to ¥4,570 billion (−11.3%) from ¥4,230 billion, and profit attributable to owners to ¥3,250 billion (−15.5%) from ¥3,000 billion, with EPS of ¥272.17 against ¥251.25 previously. The revision embeds a weaker yen assumption of ¥160/USD (from ¥150) and ¥181/EUR (from ¥180), and a vehicle-sales target raised to 9,700 thousand units from 9,600 thousand. Implied full-year margins are 6.3% at the operating line and 6.0% at the net line. Supporting assumptions include equity-method income of ¥580 billion, R&D of ¥1,600 billion, capital expenditure of ¥2,300 billion and depreciation of ¥1,650 billion. The annual dividend forecast is unchanged at ¥100.00 per share (¥50 interim, ¥50 year-end) versus ¥95.00 paid for FY3/2026, implying a 36.7% payout ratio. On the buyback, the ¥3,656.8 billion programme resolved in the March quarter was executed in full during this quarter, and a fresh repurchase authorisation of up to ¥1,000 billion was resolved in the period.
| Metric | Q1 FY3/2027 | Q1 FY3/2026 | YoY |
|---|---|---|---|
| Revenue (¥ billion) | 13,525.40 | 12,253.33 | +10.4% |
| Operating income (¥ billion) | 1,063.47 | 1,166.14 | -8.8% |
| Operating margin (%) | 7.9 | 9.5 | -1.6 pt |
| Equity-method income (¥ billion) | 210.69 | 141.04 | +49.4% |
| Other financial income (¥ billion) | 850.59 | 153.72 | +453.3% |
| Profit before tax (¥ billion) | 1,963.86 | 1,252.15 | +56.8% |
| Profit for the period (¥ billion) | 1,551.73 | 872.19 | +77.9% |
| Profit attributable to owners (¥ billion) | 1,477.04 | 841.35 | +75.6% |
| Comprehensive income (¥ billion) | 1,865.91 | 840.82 | +121.9% |
| Basic EPS (¥) | 120.69 | 64.56 | +86.9% |
| Consolidated vehicle sales (thousand units) | 2,395 | 2,411 | -0.7% |
| Operating cash flow (¥ billion) | 536.55 | 1,876.48 | -71.4% |
| Total assets (¥ billion) | 102,635.12 | 105,522.33 | -2.7% |
| Equity attributable to owners (¥ billion) | 37,308.83 | 39,918.85 | -6.5% |
| Equity ratio (%) | 36.4 | 37.8 | -1.4 pt |
| Cash and equivalents (¥ billion) | 10,343.09 | 12,659.62 | -18.3% |
| FY3/2027 guidance — revenue (¥ billion) | 54,000 | 51,000 | raised |
| FY3/2027 guidance — operating income (¥ billion) | 3,400 | 3,000 | raised |
| FY3/2027 guidance — profit attributable (¥ billion) | 3,250 | 3,000 | raised |
| FY3/2027 dividend forecast (¥ per share) | 100.00 | 95.00 | +5.3% |
JapanStockPulse provides informational content only and does not constitute investment advice. Figures are taken from the company's published earnings short report and may be subject to subsequent revision.