Rate-driven revenue, falling costs
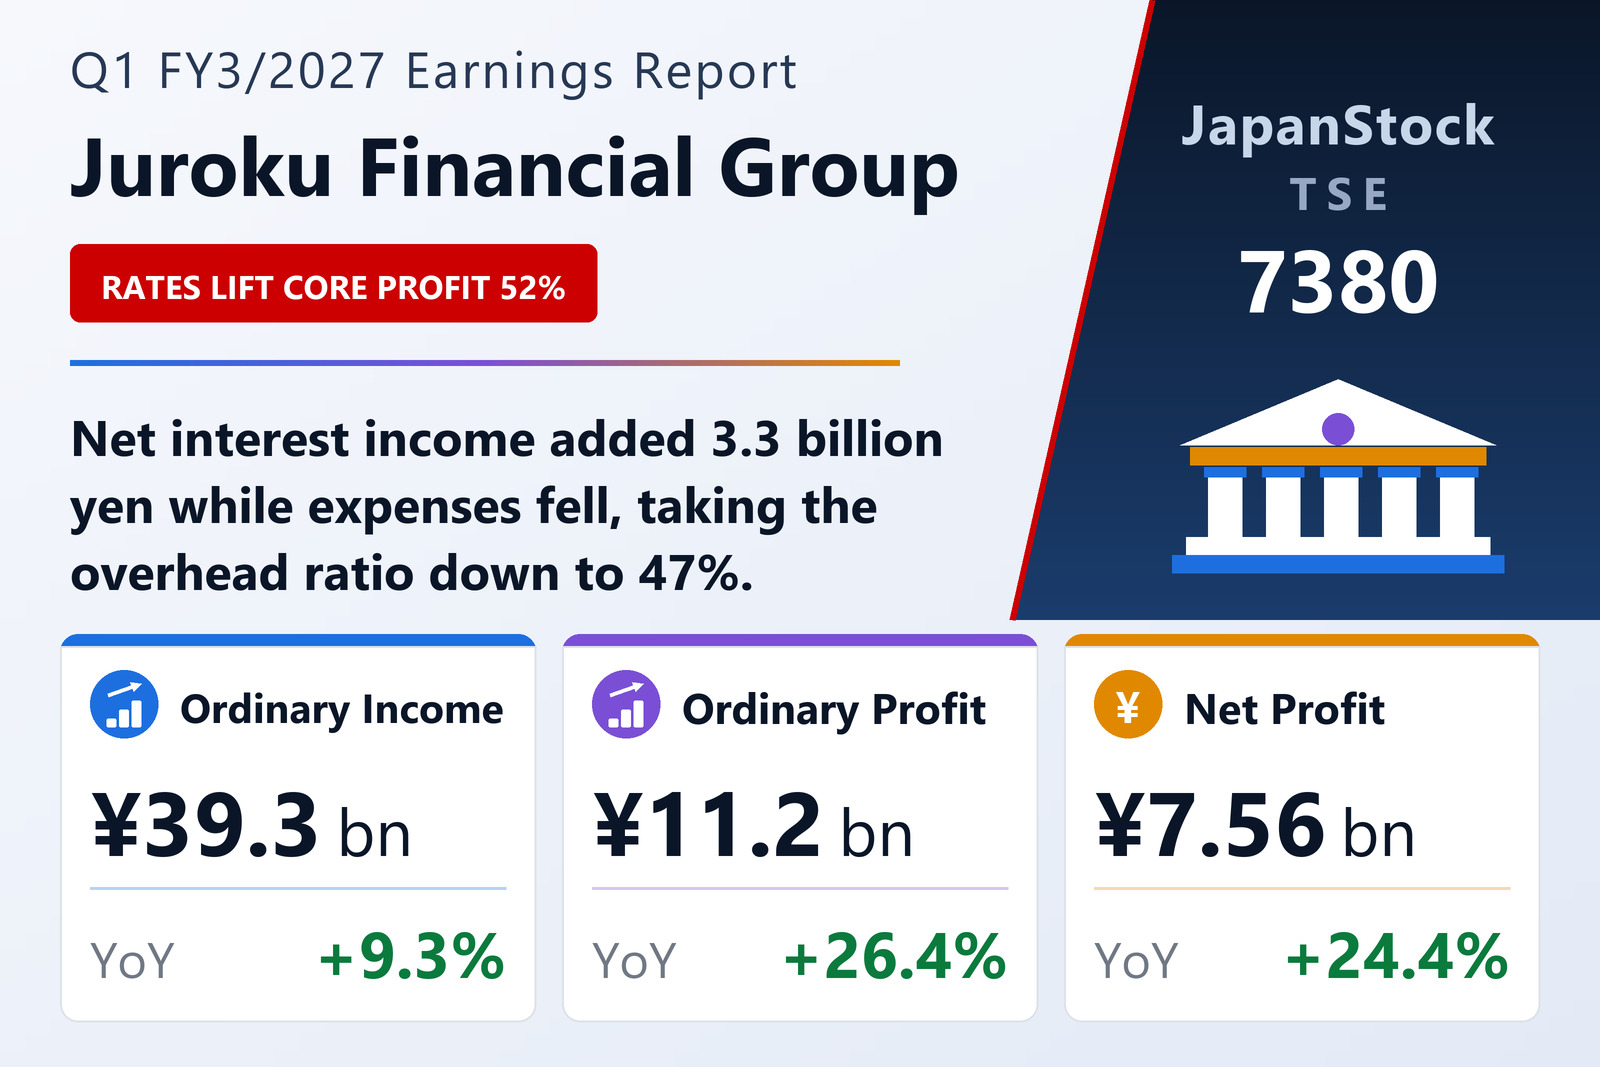
Juroku Financial Group, Inc. (TSE: 7380) published consolidated results for the three months to June 30, 2026 on August 4, 2026 under Japanese GAAP. Ordinary income rose 9.3% to ¥39,287 million, an increase of ¥3,351 million, while ordinary expenses rose only ¥1,002 million to ¥28,051 million. Ordinary profit therefore rose 26.4% to ¥11,235 million and net profit attributable to shareholders 24.4% to ¥7,560 million. Earnings per share were ¥42.69 against ¥33.86, restated for the five-for-one share split of April 1, 2026.
Underneath the reported numbers, consolidated core gross business profit rose 20.6% to ¥24,733 million. Net interest income supplied most of the gain, up 22.7% to ¥18,031 million, with net fees and commissions up 6.6% to ¥5,169 million and other operating income excluding bond results up 58.3% to ¥1,532 million. General and administrative expenses fell 1.8% to ¥11,716 million, so consolidated core net business profit rose 51.6% to ¥13,017 million and the adjusted overhead ratio improved to 47.37% from 58.13%.
Credit costs quadruple, equity gains fade
Two items worked the other way. Credit-related costs rose to ¥2,357 million from ¥504 million, an increase of ¥1,853 million, and gains on equity-related transactions fell to ¥1,199 million from ¥3,462 million. Losses on government and other bonds narrowed to ¥1,191 million from ¥2,858 million, an improvement of ¥1,667 million, so substantive net business profit still rose to ¥11,826 million from ¥5,730 million.
At the bank level, Juroku Bank's core net business profit rose to ¥12,386 million from ¥7,511 million and customer-service business profit — loan spread income plus fees, less operating expenses — to ¥5,931 million from ¥3,088 million. The bank's own adjusted overhead ratio fell to 45.06% from 57.87%.
Balance sheet, guidance and dividend
Total assets rose ¥219,183 million from the March year-end to ¥7,745,201 million, with liabilities up ¥170,577 million to ¥7,223,318 million and net assets up ¥48,606 million to ¥521,882 million. Deposits including negotiable certificates grew ¥180,876 million to ¥6,562,346 million and securities ¥117,803 million to ¥1,230,354 million, while loans and bills discounted rose only ¥7,259 million to ¥5,083,465 million. Shareholders' equity reached ¥517,089 million against ¥468,463 million, taking the group's own capital ratio to 6.6% from 6.2%. Comprehensive income of ¥53,646 million — nearly seven times the quarter's net profit — reflects the mark-to-market on that securities book.
Juroku left its guidance unchanged: full-year ordinary profit of ¥44,000 million (+2.8%) and net profit of ¥30,000 million (+9.5%), for earnings per share of ¥169.39, with the first half guided to ¥21,000 million and ¥14,500 million respectively. The first quarter has therefore delivered 25.5% of the full-year ordinary-profit target. The annual dividend forecast is ¥53.00, split ¥25.00 and ¥28.00, against ¥48.00 for FY3/2026 on the company's own split-adjusted basis.
| Metric | Q1 FY3/2027 | Q1 FY3/2026 | Change |
|---|---|---|---|
| Ordinary income (¥ million) | 39,287 | 35,936 | +9.3% |
| Consolidated core gross business profit (¥ million) | 24,733 | 20,515 | +20.6% |
| — net interest income (¥ million) | 18,031 | 14,695 | +22.7% |
| — net fees and commissions (¥ million) | 5,169 | 4,850 | +6.6% |
| — other operating income, excl. bond gains and losses (¥ million) | 1,532 | 968 | +58.3% |
| General and administrative expenses (¥ million) | 11,716 | 11,925 | -1.8% |
| Consolidated core net business profit (¥ million) | 13,017 | 8,589 | +51.6% |
| Credit-related costs (¥ million) | 2,357 | 504 | +367.7% |
| Ordinary profit (¥ million) | 11,235 | 8,886 | +26.4% |
| Net profit attrib. to owners of parent (¥ million) | 7,560 | 6,077 | +24.4% |
| Comprehensive income (¥ million) | 53,646 | 15,368 | +249.0% |
| EPS (¥) | 42.69 | 33.86 | +26.1% |
| Total assets (¥ million) | 7,745,201 | 7,526,018 | +2.9% |
| Deposits, incl. negotiable certificates (¥ million) | 6,562,346 | 6,381,470 | +2.8% |
| Loans and bills discounted (¥ million) | 5,083,465 | 5,076,206 | +0.1% |
| Securities (¥ million) | 1,230,354 | 1,112,551 | +10.6% |
| Net assets (¥ million) | 521,882 | 473,276 | +10.3% |
| Equity ratio | 6.6% | 6.2% | +0.4 pt |
| Consolidated adjusted overhead ratio | 47.37% | 58.13% | -10.76 pt |
| FY3/2027 guidance — ordinary profit (¥ million) | 44,000 | — | +2.8% |
| FY3/2027 guidance — net profit (¥ million) | 30,000 | — | +9.5% |
| FY3/2027 guidance — EPS (¥) | 169.39 | — | — |
| Annual dividend per share (¥) | 53.00 | 48.00 | +10.4% |
JapanStockPulse provides informational content only and does not constitute investment advice. Figures are taken from the company's published earnings short report and may be subject to subsequent revision.