Kidults and a Pokémon anniversary
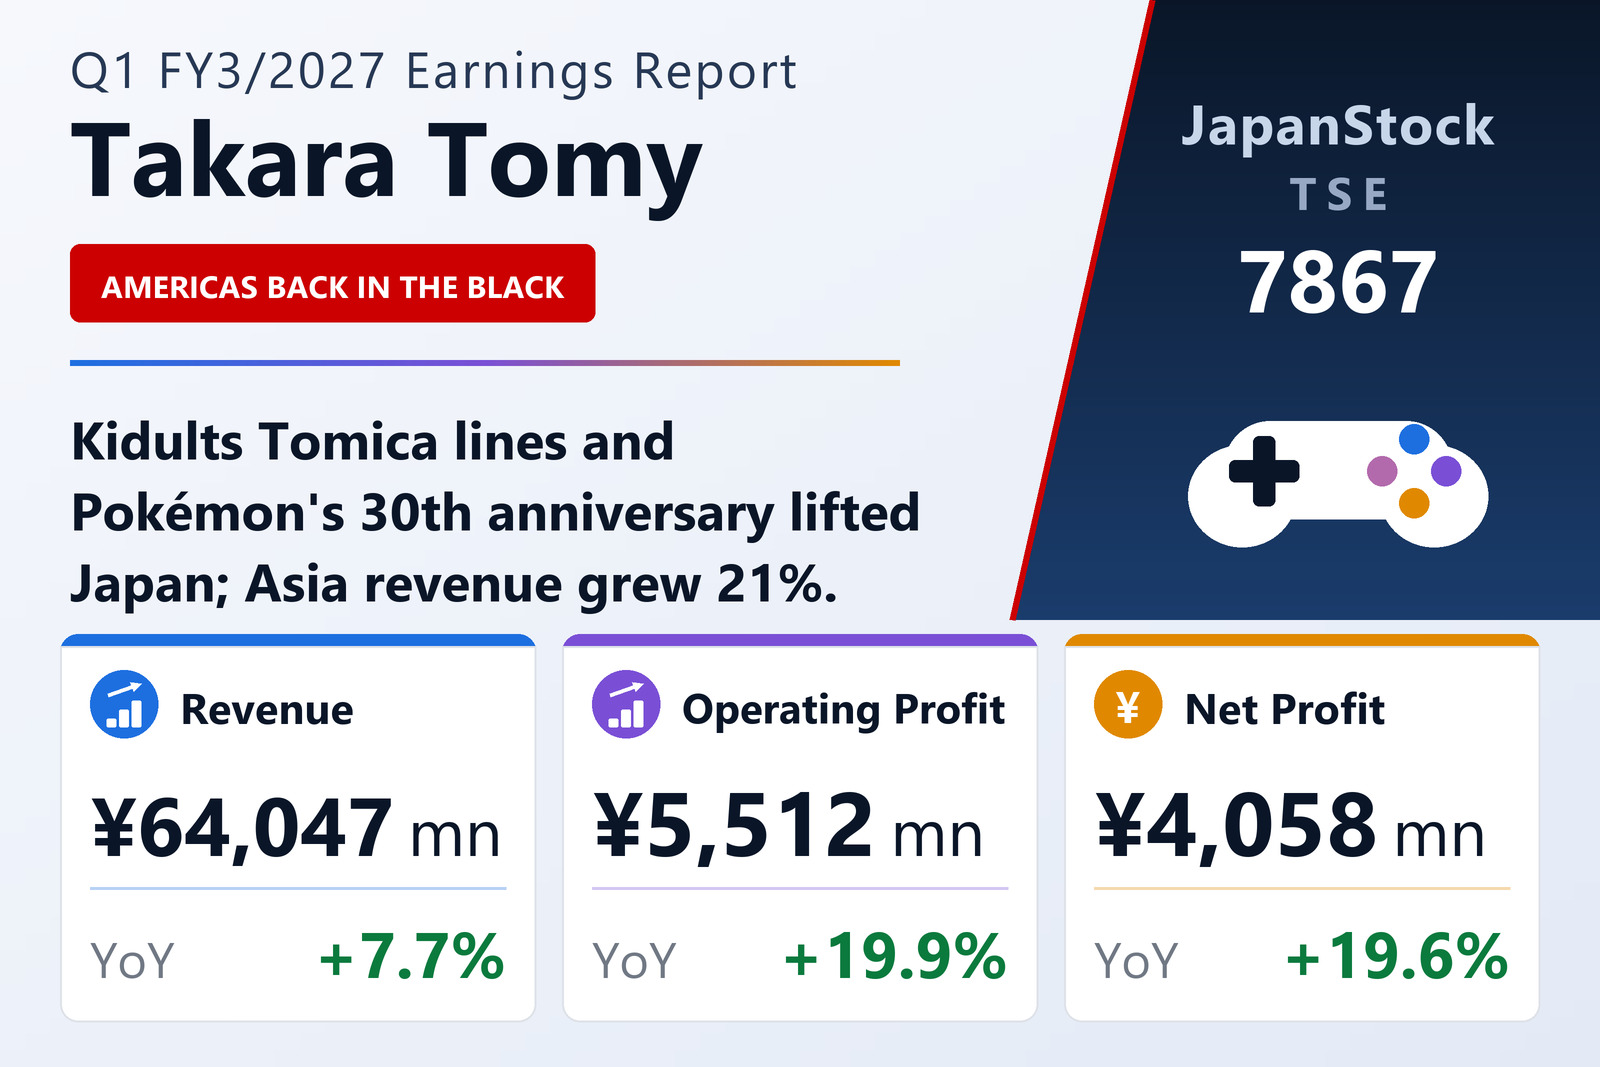
Takara Tomy Company, Ltd. (TSE: 7867) published consolidated first-quarter results for FY3/2027 on August 4, 2026, covering April 1 to June 30, 2026 under Japanese GAAP. Revenue rose 7.7% to ¥64,047 million, operating profit 19.9% to ¥5,512 million, ordinary profit 13.4% to ¥5,629 million and net profit attributable to shareholders 19.6% to ¥4,058 million. Earnings per share came to ¥46.70 against ¥37.96.
Japan, which supplies roughly seven-tenths of segment revenue, grew 8.0% to ¥56,428 million with segment profit up 5.3% to ¥6,159 million. Management credited Tomica Premium and other lines aimed at adult collectors, a sales increase in Pokémon merchandise around the franchise's 30th anniversary, and interest in Toy Story products ahead of a film release.
Overseas: three of four regions improve
The Americas were the sharpest turn. Segment revenue fell 6.7% to ¥5,096 million, yet the region posted a ¥397 million profit after a ¥254 million loss in the same quarter of the previous year. Europe grew revenue 45.4% to ¥1,468 million and narrowed its loss to ¥129 million from ¥213 million, while Oceania lifted revenue 40.4% to ¥727 million and moved to a ¥37 million profit from break-even.
Asia was the largest overseas contributor by some distance, with revenue up 20.9% to ¥20,455 million and segment profit up 29.7% to ¥845 million. Group-wide, corporate costs and intra-group eliminations absorbed ¥1,798 million against ¥1,433 million a year earlier.
Balance sheet and outlook
Total assets fell 1.8% to ¥160,449 million and net assets 2.0% to ¥108,970 million, reflecting the share buyback the board resolved on February 10, 2026; the equity ratio was effectively flat at 67.9%. Comprehensive income more than tripled to ¥5,075 million from ¥1,558 million.
Guidance for the year to March 2027 was left as issued: revenue of ¥285,000 million (+5.4%), operating profit of ¥26,000 million (+7.2%), ordinary profit of ¥26,000 million (+5.9%) and net profit of ¥18,000 million (+54.1%), for earnings per share of ¥207.26 after the buyback effect. The annual dividend forecast is ¥70.00 per share against ¥64.00 for FY3/2026.
| Metric | Q1 FY3/2027 | Q1 FY3/2026 | Change |
|---|---|---|---|
| Net sales (¥ million) | 64,047 | 59,479 | +7.7% |
| Operating profit (¥ million) | 5,512 | 4,597 | +19.9% |
| Ordinary profit (¥ million) | 5,629 | 4,965 | +13.4% |
| Net profit attrib. to owners of parent (¥ million) | 4,058 | 3,392 | +19.6% |
| Comprehensive income (¥ million) | 5,075 | 1,558 | +225.6% |
| EPS (¥) | 46.70 | 37.96 | +23.0% |
| Japan — revenue (¥ million) | 56,428 | 52,269 | +8.0% |
| Japan — segment profit (¥ million) | 6,159 | 5,847 | +5.3% |
| Asia — revenue (¥ million) | 20,455 | 16,915 | +20.9% |
| Asia — segment profit (¥ million) | 845 | 651 | +29.7% |
| Americas — revenue (¥ million) | 5,096 | 5,461 | -6.7% |
| Americas — segment profit (¥ million) | 397 | -254 | loss to profit |
| Europe — revenue (¥ million) | 1,468 | 1,010 | +45.4% |
| Europe — segment profit (¥ million) | -129 | -213 | loss narrowed |
| Oceania — revenue (¥ million) | 727 | 518 | +40.4% |
| Oceania — segment profit (¥ million) | 37 | 0 | n.m. |
| Total assets (¥ million) | 160,449 | 163,360 | -1.8% |
| Net assets (¥ million) | 108,970 | 111,167 | -2.0% |
| Equity ratio | 67.9% | 68.0% | -0.1 pt |
| FY3/2027 guidance — revenue (¥ million) | 285,000 | — | +5.4% |
| FY3/2027 guidance — operating profit (¥ million) | 26,000 | — | +7.2% |
| FY3/2027 guidance — ordinary profit (¥ million) | 26,000 | — | +5.9% |
| FY3/2027 guidance — net profit (¥ million) | 18,000 | — | +54.1% |
| FY3/2027 guidance — EPS (¥) | 207.26 | — | — |
| Annual dividend per share | 70.00 | 64.00 | +9.4% |
JapanStockPulse provides informational content only and does not constitute investment advice. Figures are taken from the company's published earnings short report and may be subject to subsequent revision.