Margin widens faster than revenue
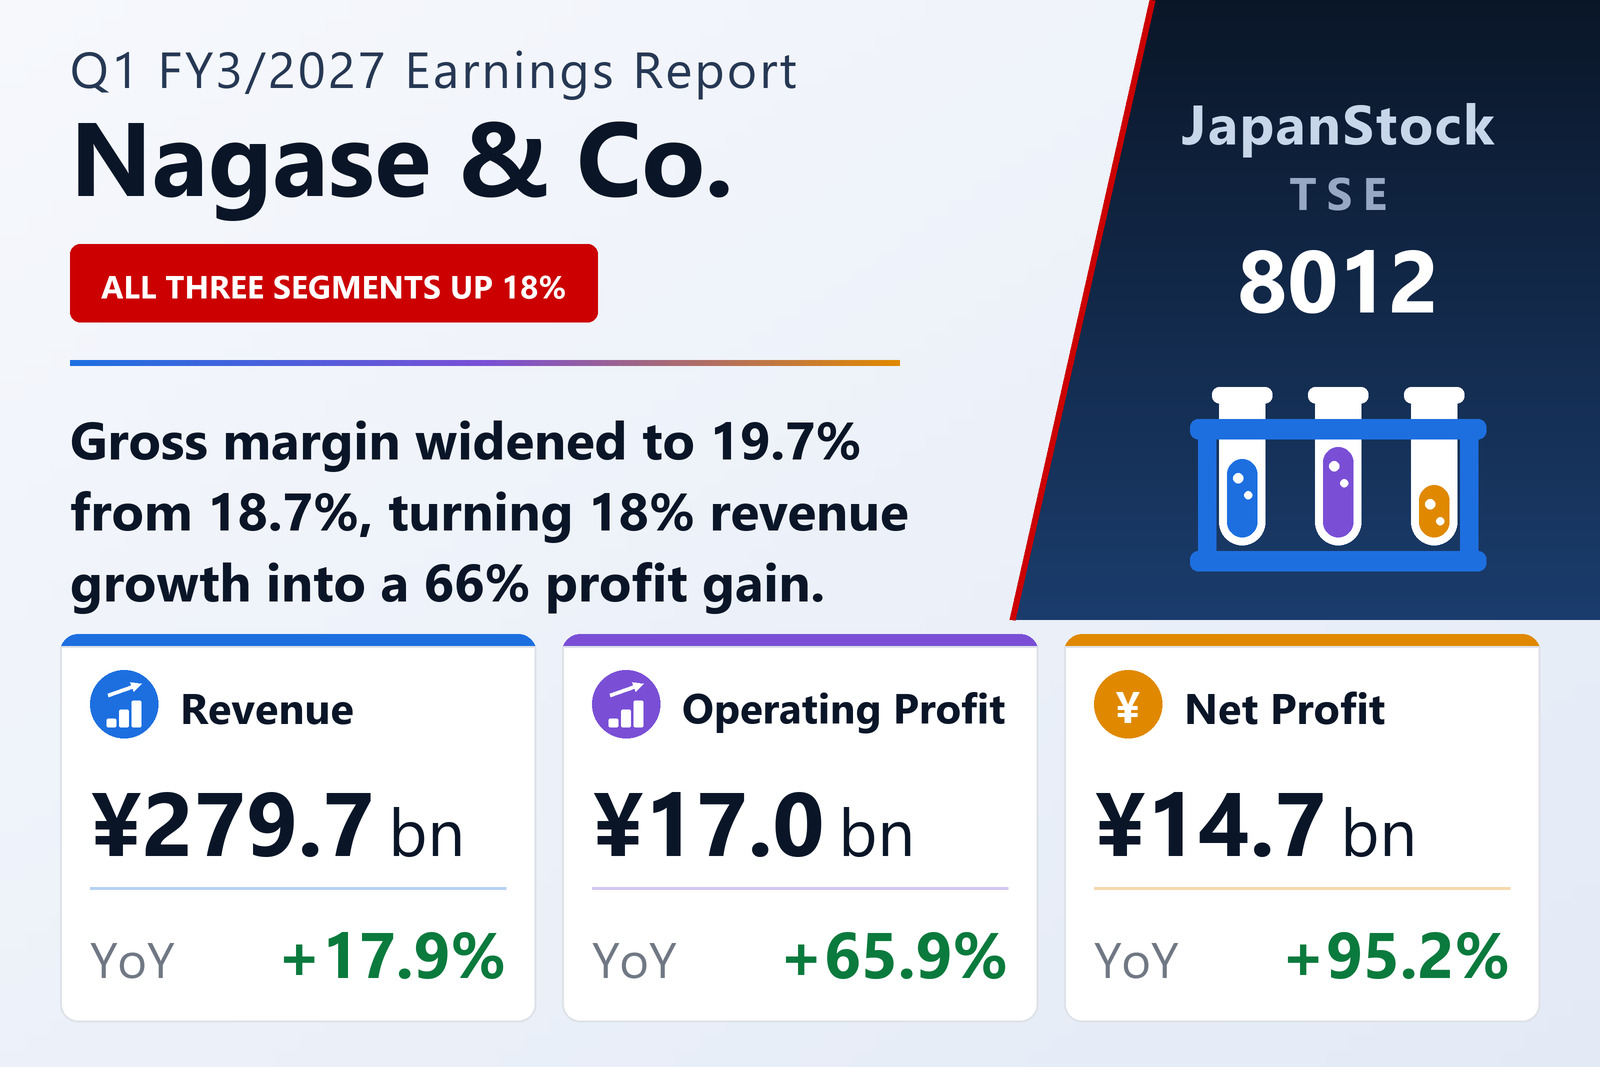
Nagase & Co., Ltd. (TSE: 8012) published consolidated first-quarter results for FY3/2027 on August 4, 2026, covering April 1 to June 30, 2026 under Japanese GAAP. Revenue rose 17.9% to ¥279,718 million and gross profit 24.4% to ¥55,154 million — a faster gain that lifted the gross margin to 19.7% from 18.7%. Operating profit climbed 65.9% to ¥17,008 million, ordinary profit 69.3% to ¥18,054 million and net profit attributable to shareholders 95.2% to ¥14,655 million.
The pattern in which profit grows several times faster than revenue is the defining feature of the quarter: an 18% top line converted into a 66% operating profit gain because gross profit outpaced revenue while operating costs did not keep step.
Three segments, one story
Materials, the largest segment, grew revenue 18.0% to ¥140,549 million and segment profit 63.2% to ¥8,193 million. Electronics matched it almost exactly on the top line, up 18.0% to ¥49,594 million, with segment profit up 60.4% to ¥4,931 million. Life Science grew revenue 17.3% to ¥90,443 million and segment profit 36.6% to ¥2,907 million — the slowest profit growth of the three but still comfortably ahead of its revenue.
The consolidation scope changed during the quarter: Fukui Yamada Chemical Industry Co., Ltd. was removed from consolidation. Comprehensive income reached ¥27,685 million against ¥1,768 million a year earlier, more than fifteen times the prior-year figure.
Split, balance sheet and outlook
Nagase carried out a four-for-one common share split effective April 1, 2026. Per-share figures for the prior year have been restated as if the split had taken place at the start of that period, so earnings per share of ¥35.93 compares with a restated ¥17.40. The dividend line is not restated: the ¥27.00 annual forecast for FY3/2027 is stated post-split, while the ¥100.00 paid for FY3/2026 is the actual pre-split amount.
Total assets rose 8.1% to ¥942,118 million and net assets 5.1% to ¥456,064 million, with the equity ratio easing to 47.4% from 48.8%. Full-year guidance is unchanged at ¥1,000,000 million of revenue (+2.8%), ¥198,000 million of gross profit (+5.5%), ¥45,000 million of operating profit (+0.6%), ¥45,000 million of ordinary profit (+2.1%) and ¥34,500 million of net profit (+4.2%), for earnings per share of ¥84.59. The company said it intends to update the full-year outlook when it reports second-quarter results, after reviewing market trends and demand in light of the situation in the Middle East.
| Metric | Q1 FY3/2027 | Q1 FY3/2026 | Change |
|---|---|---|---|
| Net sales (¥ million) | 279,718 | 237,314 | +17.9% |
| Gross profit (¥ million) | 55,154 | 44,331 | +24.4% |
| Operating profit (¥ million) | 17,008 | 10,249 | +65.9% |
| Ordinary profit (¥ million) | 18,054 | 10,662 | +69.3% |
| Net profit attrib. to owners of parent (¥ million) | 14,655 | 7,507 | +95.2% |
| Comprehensive income (¥ million) | 27,685 | 1,768 | n.m. |
| EPS (¥) | 35.93 | 17.40 | +106.5% |
| Materials — revenue (¥ million) | 140,549 | 119,143 | +18.0% |
| Materials — segment profit (¥ million) | 8,193 | 5,020 | +63.2% |
| Electronics — revenue (¥ million) | 49,594 | 42,026 | +18.0% |
| Electronics — segment profit (¥ million) | 4,931 | 3,075 | +60.4% |
| Life Science — revenue (¥ million) | 90,443 | 77,075 | +17.3% |
| Life Science — segment profit (¥ million) | 2,907 | 2,128 | +36.6% |
| Total assets (¥ million) | 942,118 | 871,526 | +8.1% |
| Net assets (¥ million) | 456,064 | 434,025 | +5.1% |
| Equity ratio | 47.4% | 48.8% | -1.4 pt |
| FY3/2027 guidance — revenue (¥ million) | 1,000,000 | — | +2.8% |
| FY3/2027 guidance — operating profit (¥ million) | 45,000 | — | +0.6% |
| FY3/2027 guidance — ordinary profit (¥ million) | 45,000 | — | +2.1% |
| FY3/2027 guidance — net profit (¥ million) | 34,500 | — | +4.2% |
| FY3/2027 guidance — EPS (¥) | 84.59 | — | — |
| Annual dividend per share | 27.00 | 100.00 | n.m. |
JapanStockPulse provides informational content only and does not constitute investment advice. Figures are taken from the company's published earnings short report and may be subject to subsequent revision.