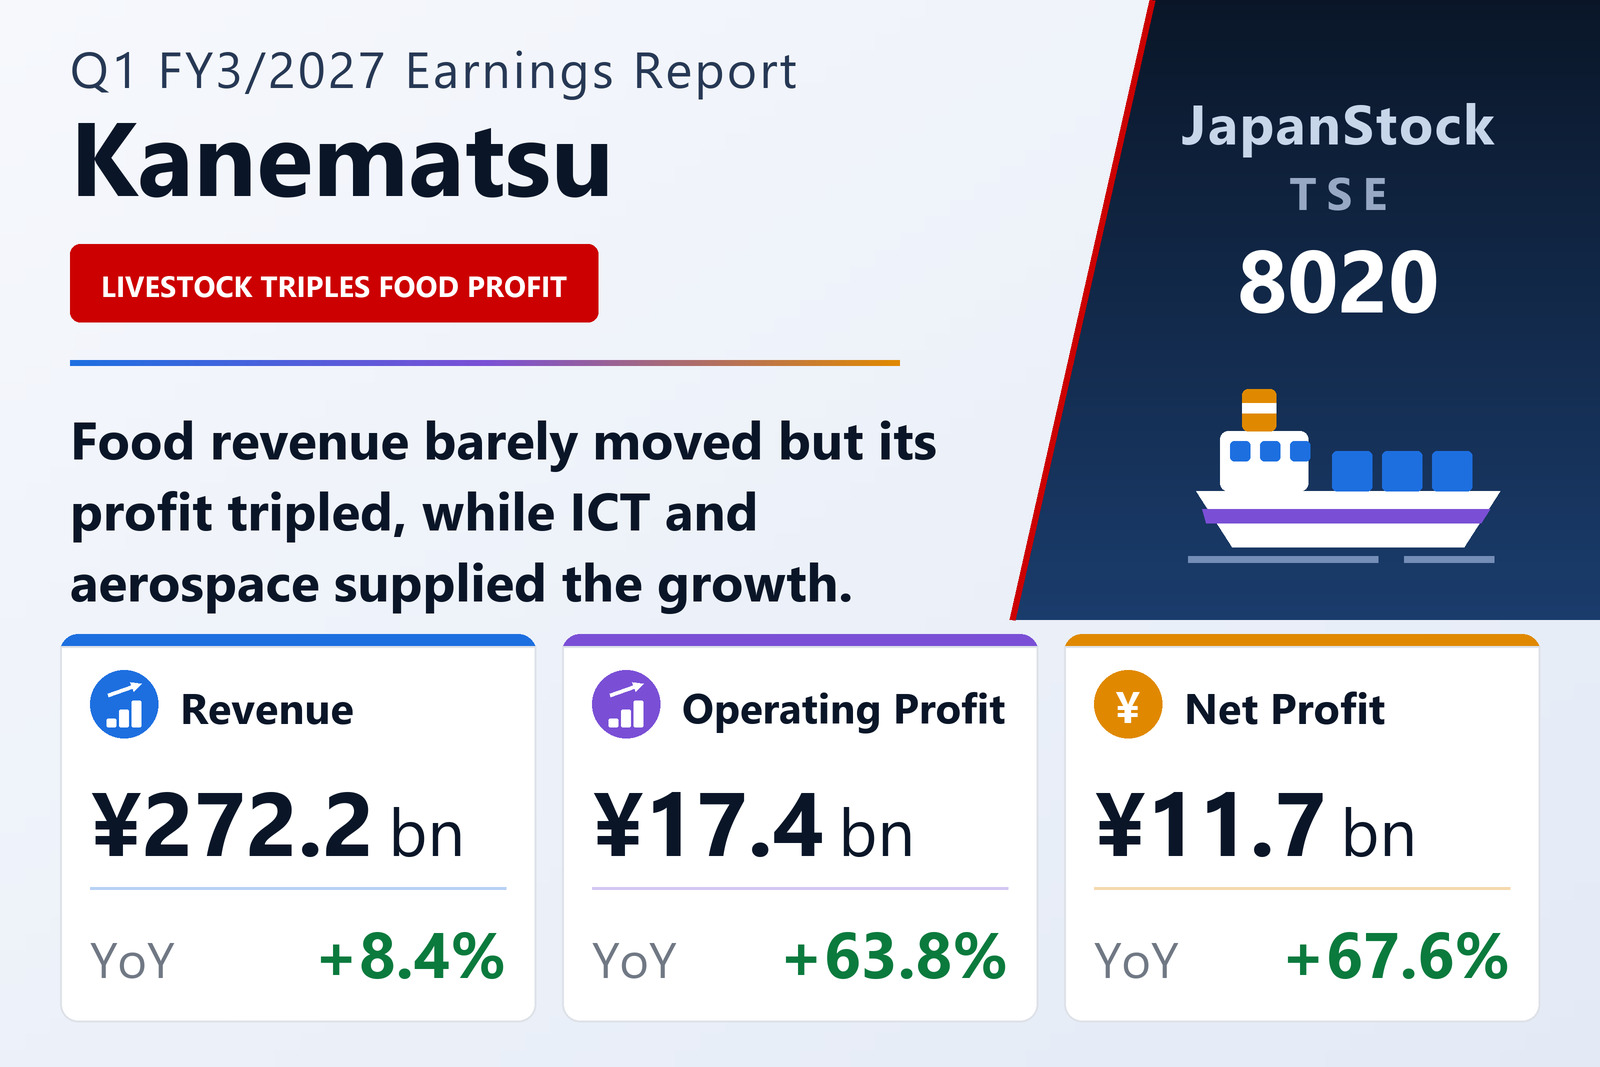
Gross profit up a fifth, operating profit up nearly two-thirds
Kanematsu Corporation (TSE: 8020) published consolidated results for the three months to June 30, 2026 on August 4, 2026 under IFRS. Revenue rose 8.4% to ¥272,167 million, an increase of ¥21,051 million, and gross profit 19.4% to ¥46,926 million, up ¥7,630 million. Profit from operating activities — the line Kanematsu labels as operating profit — rose 63.8% to ¥17,431 million, an increase of ¥6,791 million. The gap between the revenue and gross-profit growth rates is the story of the quarter: mix, not volume, did most of the work.
Pre-tax profit rose 61.5% to ¥17,190 million and net profit attributable to owners of the parent 67.6% to ¥11,703 million, up ¥4,719 million. Earnings per share were ¥70.33 against ¥42.02, both restated for the two-for-one share split of January 1, 2026. Comprehensive income rose 27.6% to ¥10,791 million.
Foods triples its profit without growing
Foods was the largest segment by revenue at ¥94,394 million, essentially flat on the year — down ¥234 million as flour trading was slow — but segment profit more than tripled to ¥5,159 million from ¥1,668 million on strong livestock trading and beverage-ingredient related business, and profit attributable to owners rose ¥2,067 million to ¥3,025 million. Electronics & Devices, the second-largest, grew revenue 12.2% to ¥73,599 million and profit 30.9% to ¥5,031 million on electronic equipment, electronic materials and mobile.
ICT Solutions grew fastest on the top line, up 19.8% to ¥24,810 million with profit 26.0% higher at ¥2,914 million, driven by network business for manufacturing customers — semiconductors in particular — and server-related work for the education and public sectors. Motor Vehicles & Aerospace lifted revenue 16.5% to ¥34,395 million and profit 73.1% to ¥2,363 million as defence-related trading expanded. Steel, Materials & Plant grew revenue 10.8% to ¥44,478 million and profit 31.9% to ¥2,052 million on the energy business. The residual Other business had revenue of ¥488 million and an operating loss of ¥104 million.
Balance sheet, guidance and dividend
Total assets slipped ¥3,571 million from the March year-end to ¥729,438 million. Interest-bearing debt, which excludes lease liabilities, rose ¥7,858 million to ¥162,705 million, and net interest-bearing debt after cash rose ¥14,509 million to ¥109,122 million. Equity attributable to owners of the parent rose ¥4,682 million to ¥213,073 million on retained profit, lifting the equity-attributable ratio to 29.2% from 28.4%; the net debt-to-equity ratio stood at 0.51 times.
Kanematsu left its full-year guidance unchanged: revenue of ¥1,100,000 million (+3.0%), operating profit of ¥54,000 million (+11.0%), pre-tax profit of ¥50,000 million (+6.0%) and net profit attributable to owners of ¥35,000 million (+7.6%), for earnings per share of ¥210.41. The first quarter has therefore delivered 32.3% of the full-year operating-profit target. The annual dividend forecast is ¥70.00, split ¥35.00 and ¥35.00, against ¥63.00 for FY3/2026 on a split-adjusted basis.
| Metric | Q1 FY3/2027 | Q1 FY3/2026 | Change |
|---|---|---|---|
| Revenue (¥ million) | 272,167 | 251,116 | +8.4% |
| Gross profit (¥ million) | 46,926 | 39,296 | +19.4% |
| Operating profit (¥ million) | 17,431 | 10,640 | +63.8% |
| Pre-tax profit (¥ million) | 17,190 | 10,645 | +61.5% |
| Net profit attrib. to owners of parent (¥ million) | 11,703 | 6,984 | +67.6% |
| Comprehensive income (¥ million) | 10,791 | 8,457 | +27.6% |
| EPS (¥) | 70.33 | 42.02 | +67.4% |
| ICT Solutions — revenue (¥ million) | 24,810 | 20,712 | +19.8% |
| ICT Solutions — segment profit (¥ million) | 2,914 | 2,312 | +26.0% |
| Electronics & Devices — revenue (¥ million) | 73,599 | 65,601 | +12.2% |
| Electronics & Devices — segment profit (¥ million) | 5,031 | 3,842 | +30.9% |
| Foods — revenue (¥ million) | 94,394 | 94,628 | -0.2% |
| Foods — segment profit (¥ million) | 5,159 | 1,668 | +209.3% |
| Steel, Materials & Plant — revenue (¥ million) | 44,478 | 40,156 | +10.8% |
| Steel, Materials & Plant — segment profit (¥ million) | 2,052 | 1,556 | +31.9% |
| Motor Vehicles & Aerospace — revenue (¥ million) | 34,395 | 29,528 | +16.5% |
| Motor Vehicles & Aerospace — segment profit (¥ million) | 2,363 | 1,365 | +73.1% |
| Total assets (¥ million) | 729,438 | 733,009 | -0.5% |
| Shareholders' equity (¥ million) | 229,622 | 223,474 | +2.8% |
| Equity attrib. to owners of parent (¥ million) | 213,073 | 208,391 | +2.2% |
| Equity ratio | 29.2% | 28.4% | +0.8 pt |
| FY3/2027 guidance — revenue (¥ million) | 1,100,000 | — | +3.0% |
| FY3/2027 guidance — operating profit (¥ million) | 54,000 | — | +11.0% |
| FY3/2027 guidance — pre-tax profit (¥ million) | 50,000 | — | +6.0% |
| FY3/2027 guidance — net profit (¥ million) | 35,000 | — | +7.6% |
| FY3/2027 guidance — EPS (¥) | 210.41 | — | — |
| Annual dividend per share (¥) | 70.00 | 63.00 | +11.1% |
JapanStockPulse provides informational content only and does not constitute investment advice. Figures are taken from the company's published earnings short report and may be subject to subsequent revision.