Rates work through both sides of the book
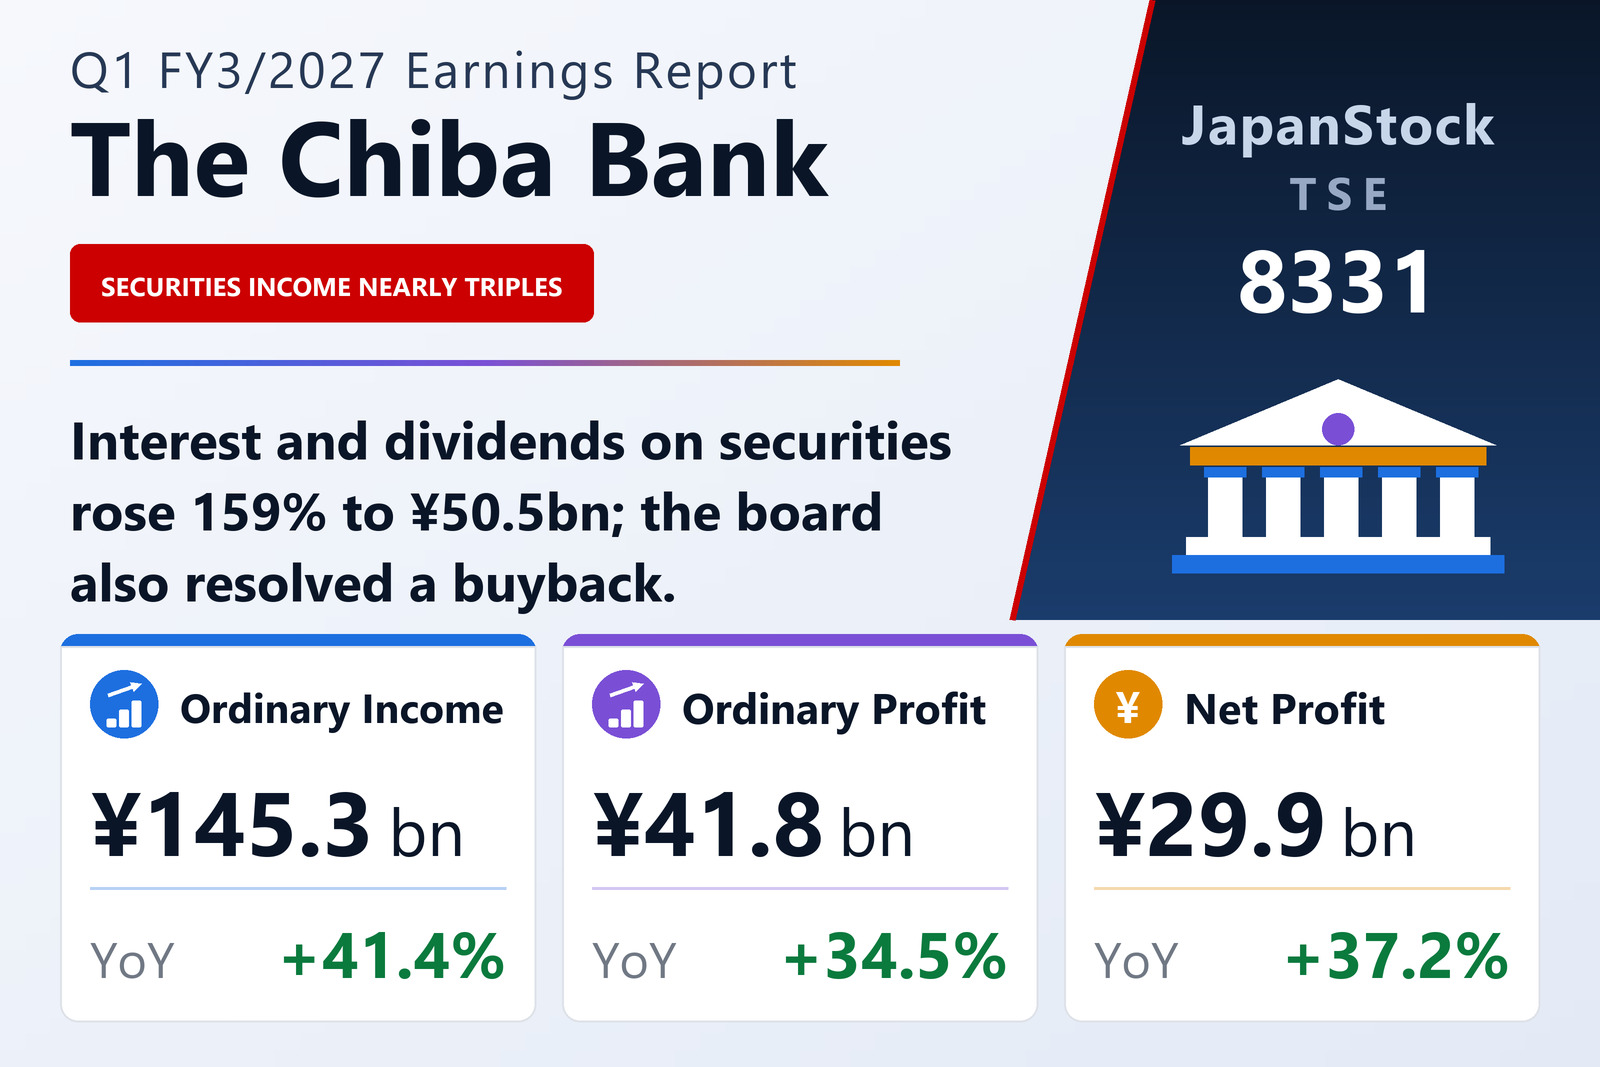
The Chiba Bank, Ltd. (TSE: 8331) published consolidated first-quarter results for FY3/2027 on August 4, 2026, covering April 1 to June 30, 2026 under Japanese GAAP. Ordinary income rose 41.4% to ¥145,309 million while ordinary expenses rose 44.4% to ¥103,495 million. Ordinary profit still climbed 34.5% to ¥41,814 million and net profit attributable to shareholders 37.2% to ¥29,905 million, for earnings per share of ¥43.16 against ¥30.79.
The driver on the revenue side was interest income, up 55.5% to ¥112,161 million. Within that, interest and dividends on securities rose 159.1% to ¥50,456 million — nearly triple the ¥19,475 million booked a year earlier — while interest on loans grew 26.7% to ¥55,572 million. Fees and commissions income added 15.8% to ¥17,640 million.
A portfolio being reshaped
The cost side tells the other half of the story. Funding costs rose 12.4% to ¥30,004 million, with deposit interest up 33.8% to ¥16,023 million, and general and administrative expenses were held to a 5.9% increase at ¥27,924 million. The largest expense movement, however, was in other business expenses, which jumped to ¥29,171 million from ¥3,280 million — the counterpart to the securities income surge, consistent with a portfolio being repositioned out of lower-yielding holdings.
Comprehensive income rose 39.6% to ¥64,348 million. Net assets grew 2.4% to ¥1,287,108 million and the capital ratio, calculated on the bank's own definition rather than the regulatory one, was unchanged at 5.9%.
Deposits grow, loans hold flat
Total assets rose 1.2% from the March year-end to ¥21,465,007 million. Deposits increased 0.9% to ¥16,982,501 million, an advance the bank attributed to household deposits as it pushed to be the primary bank for family finances. Loans and bills discounted were essentially flat at ¥14,085,402 million, while securities grew 4.1% to ¥3,636,483 million.
The board resolved on August 4, 2026 to carry out a share buyback; the earnings-per-share figure in the full-year forecast already reflects it. Guidance issued on May 15, 2026 was left unchanged: ordinary profit of ¥154,300 million (+11.1%) and net profit of ¥107,000 million (+13.7%) for the year to March 2027, with earnings per share of ¥155.40. The annual dividend forecast is ¥64.00 per share against ¥52.00 for FY3/2026.
| Metric | Q1 FY3/2027 | Q1 FY3/2026 | Change |
|---|---|---|---|
| Ordinary income (¥ million) | 145,309 | 102,755 | +41.4% |
| — interest income (¥ million) | 112,161 | 72,119 | +55.5% |
| —— interest on loans (¥ million) | 55,572 | 43,855 | +26.7% |
| —— interest and dividends on securities (¥ million) | 50,456 | 19,475 | +159.1% |
| — fees and commissions income (¥ million) | 17,640 | 15,228 | +15.8% |
| Ordinary expenses (¥ million) | 103,495 | 71,685 | +44.4% |
| — funding costs (¥ million) | 30,004 | 26,692 | +12.4% |
| — general and administrative expenses (¥ million) | 27,924 | 26,368 | +5.9% |
| Ordinary profit (¥ million) | 41,814 | 31,070 | +34.5% |
| Net profit attrib. to owners of parent (¥ million) | 29,905 | 21,783 | +37.2% |
| Comprehensive income (¥ million) | 64,348 | 46,091 | +39.6% |
| EPS (¥) | 43.16 | 30.79 | +40.2% |
| Total assets (¥ million) | 21,465,007 | 21,211,781 | +1.2% |
| Deposits (¥ million) | 16,982,501 | 16,830,424 | +0.9% |
| Loans and bills discounted (¥ million) | 14,085,402 | 14,082,336 | +0.0% |
| Securities (¥ million) | 3,636,483 | 3,491,819 | +4.1% |
| Net assets (¥ million) | 1,287,108 | 1,257,300 | +2.4% |
| Equity ratio | 5.9% | 5.9% | unchanged |
| FY3/2027 guidance — ordinary profit (¥ million) | 154,300 | — | +11.1% |
| FY3/2027 guidance — net profit (¥ million) | 107,000 | — | +13.7% |
| FY3/2027 guidance — EPS (¥) | 155.40 | — | — |
| Annual dividend per share | 64.00 | 52.00 | +23.1% |
JapanStockPulse provides informational content only and does not constitute investment advice. Figures are taken from the company's published earnings short report and may be subject to subsequent revision.