A quarter shaped by what did not repeat
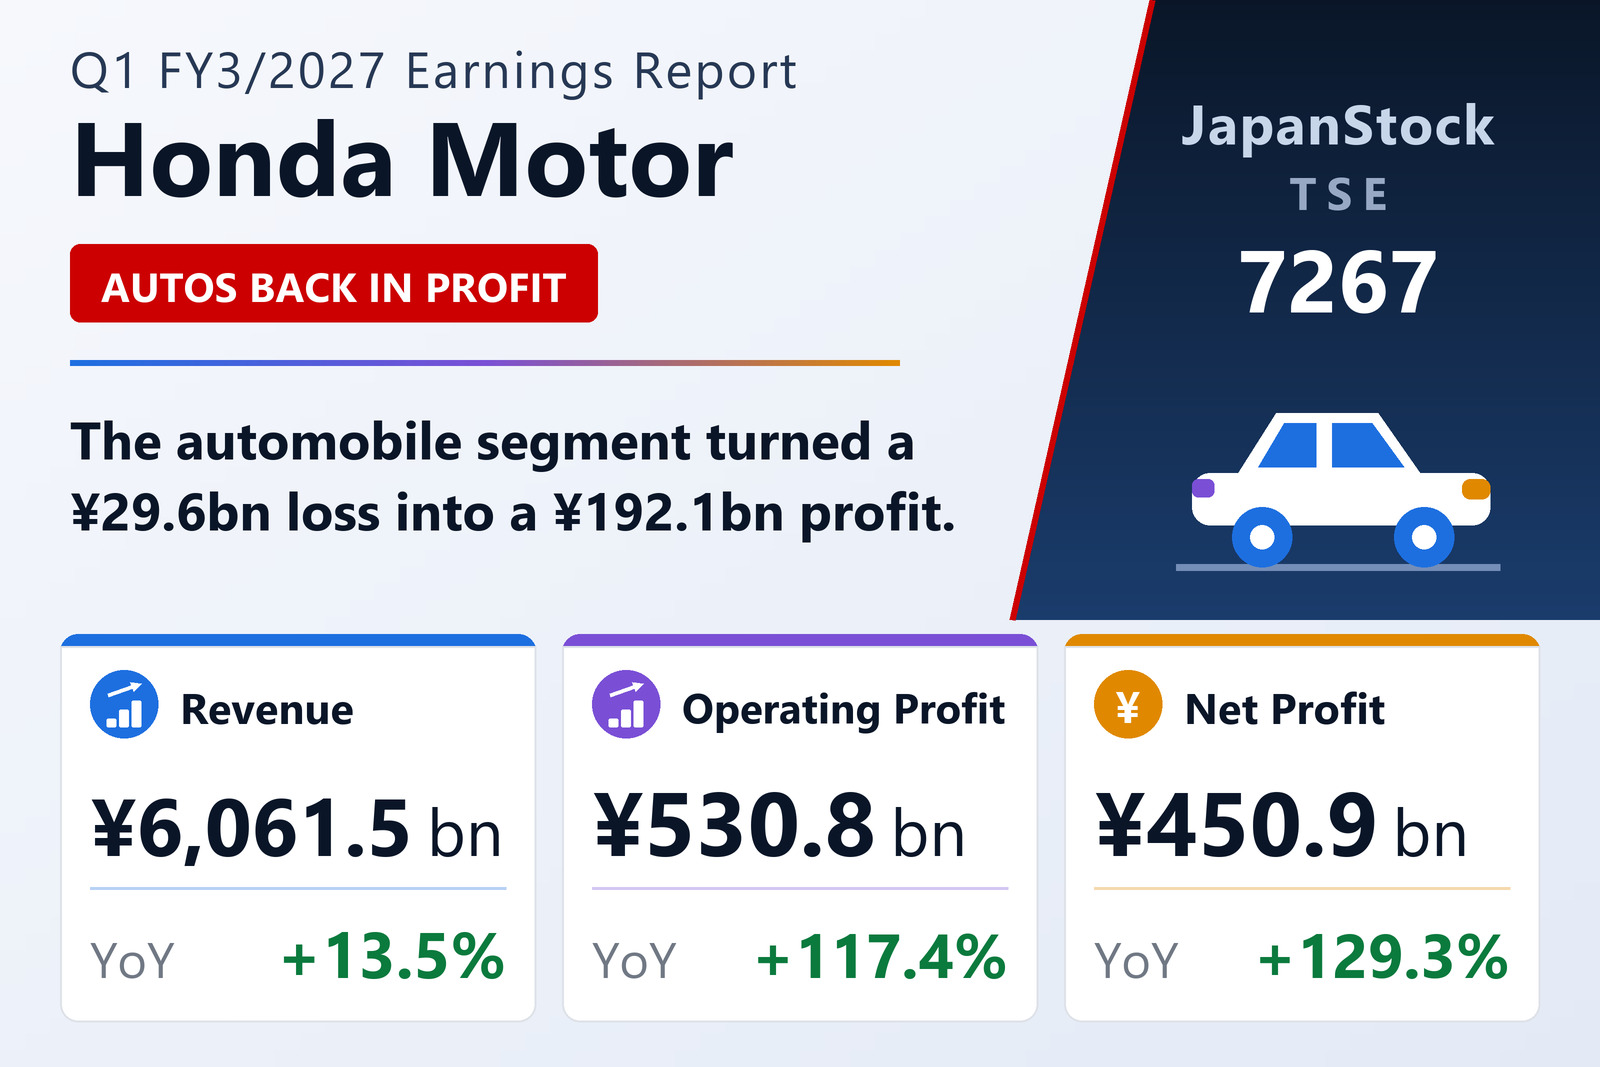
Honda Motor Co., Ltd. (TSE: 7267) published consolidated results for the three months to June 30, 2026 on August 5, 2026 under IFRS. Revenue rose 13.5% to ¥6,061,514 million — against a 1.2% decline a year earlier — lifted by growth in financial services and motorcycles and by currency translation. Operating profit rose 117.4% to ¥530,767 million after a 49.6% fall in the same quarter last year, widening the operating margin from 4.6% to 8.8%.
Honda attributes the profit swing principally to the electric-vehicle-related losses recorded in the year-earlier quarter, alongside the effect of tariffs. Profit before tax rose 107.0% to ¥605,027 million and profit attributable to owners of the parent 129.3% to ¥450,915 million, for basic earnings per share of ¥115.84 against ¥46.80. Comprehensive income was ¥692,332 million, against a loss of ¥3,836 million a year earlier.
Automobiles back in the black, motorcycles still the profit engine
The automobile segment lifted revenue 9.6% to ¥3,807,349 million and turned an operating loss of ¥29,625 million into a profit of ¥192,122 million. That reversal accounts for the bulk of the group's ¥286.6 billion increase in operating profit.
Motorcycles nevertheless remain the single largest profit contributor. Segment revenue rose 19.9% to ¥1,141,131 million and operating profit 23.8% to ¥233,956 million — a 20.5% margin, more than four times the automobile segment's. Financial services grew revenue 23.4% to ¥1,026,137 million and operating profit 24.5% to ¥105,810 million. Power products and other businesses posted revenue of ¥94,465 million and an operating loss of ¥1,121 million.
Balance sheet expands on fixed assets and currency
Total assets closed the quarter at ¥34,437,975 million, up ¥928.6 billion from the March year-end on higher property, plant and equipment and currency translation. Total liabilities rose ¥448.1 billion to ¥21,809.3 billion as funding-related debt increased, while total equity rose ¥480.5 billion to ¥12,628,578 million on retained earnings. Equity attributable to owners of the parent reached ¥12,361,471 million, for a ratio of 35.9% against 35.3%.
Full-year guidance revised
Honda revised its FY3/2027 forecast from the figure previously announced. It now guides to revenue of ¥24,150,000 million (+10.8%), operating profit of ¥650,000 million, profit before tax of ¥660,000 million, profit for the year of ¥480,000 million and profit attributable to owners of the parent of ¥400,000 million, for earnings per share of ¥102.75. The company does not disclose year-on-year percentages for the profit lines. The annual dividend forecast is unchanged at ¥70.00 per share (¥35.00 interim plus ¥35.00 year-end).
Two open exposures are flagged in the notes. Honda continues to carry provisions for product warranty costs relating to airbag inflater market measures, and says additional provisions may become necessary. Separately, following last year's decision to cancel the launch and development of an EV model planned for North American production, the company has begun assessing the impact on suppliers; additional payments may arise, but their amount and timing cannot yet be reliably estimated.
| Metric | Q1 FY3/2027 | Q1 FY3/2026 | Change |
|---|---|---|---|
| Revenue (¥ million) | 6,061,514 | 5,340,268 | +13.5% |
| Operating profit (¥ million) | 530,767 | 244,170 | +117.4% |
| Operating margin | 8.8% | 4.6% | +4.2 pt |
| Pre-tax profit (¥ million) | 605,027 | 292,334 | +107.0% |
| Net profit attrib. to owners of parent (¥ million) | 450,915 | 196,670 | +129.3% |
| Comprehensive income (¥ million) | 692,332 | −3,836 | loss to profit |
| EPS (¥) | 115.84 | 46.80 | +147.5% |
| Motorcycle — revenue (¥ million) | 1,141,131 | 951,590 | +19.9% |
| Motorcycle — segment profit (¥ million) | 233,956 | 189,005 | +23.8% |
| Automobile — revenue (¥ million) | 3,807,349 | 3,474,601 | +9.6% |
| Automobile — segment profit (¥ million) | 192,122 | −29,625 | loss to profit |
| Financial Services — revenue (¥ million) | 1,026,137 | 831,621 | +23.4% |
| Financial Services — segment profit (¥ million) | 105,810 | 85,009 | +24.5% |
| Total assets (¥ million) | 34,437,975 | 33,509,285 | +2.8% |
| Equity attrib. to owners of parent (¥ million) | 12,361,471 | 11,817,512 | +4.6% |
| Equity ratio | 35.9% | 35.3% | +0.6 pt |
| FY3/2027 guidance — revenue (¥ million) | 24,150,000 | — | +10.8% |
| FY3/2027 guidance — operating profit (¥ million) | 650,000 | — | n.m. |
| FY3/2027 guidance — pre-tax profit (¥ million) | 660,000 | — | n.m. |
| FY3/2027 guidance — net profit (¥ million) | 400,000 | — | n.m. |
| FY3/2027 guidance — EPS (¥) | 102.75 | — | n.m. |
| Annual dividend per share (¥) | 70.00 | 70.00 | unchanged |
JapanStockPulse provides informational content only and does not constitute investment advice. Figures are taken from the company's published earnings short report and may be subject to subsequent revision.