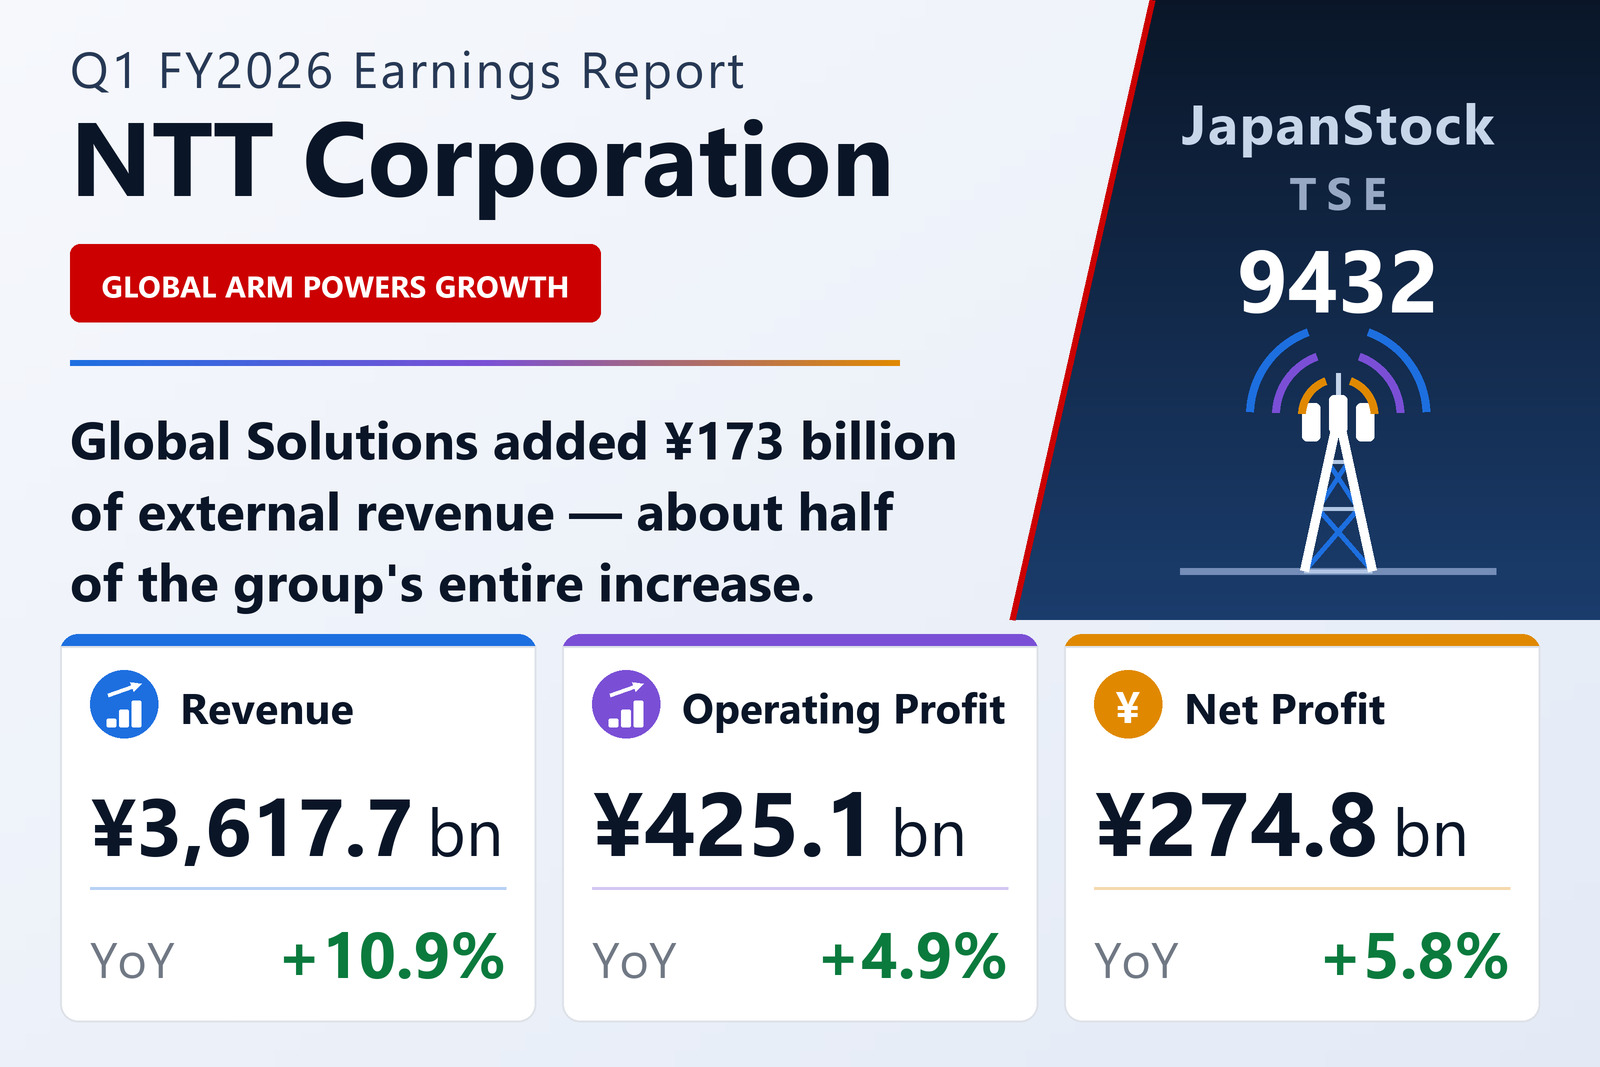
Half the group's growth came from one segment
NTT Corporation (TSE: 9432), Japan's largest telecommunications group and the parent of NTT Docomo, NTT East and West, NTT Data and NTT's overseas solutions businesses, reported consolidated results for the first quarter of fiscal 2026 — the three months from April 1 to June 30, 2026 — under IFRS on August 6, 2026. Operating revenue rose 10.9% to ¥3,617,707 million from ¥3,262,039 million. That is a sharp acceleration: the same quarter a year earlier grew 0.7%, and every line beneath it then fell.
The ¥355,668 million of additional revenue did not arrive evenly across the four reporting segments. Global Solutions — consulting, IT solutions, system and software development, maintenance and support, and data centres — added ¥172,614 million of external revenue on its own, a 16.4% gain to ¥1,226,979 million. That one segment supplied 48.5% of the group's entire revenue increase. Integrated ICT added ¥118,667 million, or 33.4% of the increase; "Other," which is principally real estate and energy, added ¥53,018 million, or 14.9%; and Regional Communications, the fixed-line and fibre business of NTT East and NTT West, added ¥11,369 million, or 3.2%.
Put another way, nearly two-thirds of NTT's revenue growth this quarter came from businesses that are not the domestic mobile network. That matters below the revenue line, because those businesses do not carry the domestic network's margins.
Costs grew faster than revenue, and the margin gave way
Total operating expenses rose 11.8% to ¥3,192,558 million from ¥2,856,846 million — faster than the 10.9% on the revenue line. The arithmetic is unforgiving. Revenue added ¥355,668 million; costs added ¥335,712 million; only ¥19,956 million survived to reach the operating line. Operating profit rose 4.9% to ¥425,149 million, and the operating margin narrowed to 11.75% from 12.42%, a loss of 0.67 percentage points.
The increase is concentrated in a single line. "Expenses" — the catch-all covering purchased goods and services, outsourcing, commissions and other running costs — rose 15.4% to ¥1,812,537 million, an increase of ¥241,488 million that alone accounts for 72% of the ¥335,712 million total cost increase. Personnel costs rose 9.2% to ¥857,687 million, an increase of ¥72,187 million — slower than revenue, so labour was not the problem.
The most telling line is depreciation and amortisation, up only 3.1% to ¥452,493 million, an increase of ¥13,715 million. For a group that spent ¥630,294 million on fixed assets in the same three months, near-flat depreciation says that the revenue NTT added this quarter was bought largely with purchased inputs rather than with owned network capacity — which is precisely what a shift toward solutions and services revenue looks like in a cost statement. The remaining lines are small: loss on disposal of fixed assets ¥21,822 million against ¥19,298 million, impairment ¥3,541 million against ¥1,674 million, and taxes and dues ¥44,478 million against ¥40,547 million.
Integrated ICT and Global Solutions pull in opposite directions
Integrated ICT — consumer mobile and fibre broadband, the smart-life financial and content services, and the corporate solutions business, essentially the NTT Docomo group — is still the centre of gravity: ¥1,542,221 million of external revenue, 42.6% of the group total, and ¥246,218 million of segment profit, 57.0% of the segment total. External revenue rose 8.3% and total revenue including inter-segment sales rose 8.5% to ¥1,617,031 million. Yet segment profit rose only 2.7%, from ¥239,682 million, so the segment margin fell to 15.2% from 16.1%.
Global Solutions is the mirror image. Total segment revenue rose 15.8% to ¥1,278,935 million and segment profit rose 9.9% to ¥63,493 million — the faster profit growth of the two big segments — but the segment margin is 5.0%, against 15.2% at Integrated ICT. That gap is the entire margin story of this quarter. Global Solutions now supplies 33.9% of group external revenue and only 14.7% of segment profit; every yen of mix that moves from domestic ICT toward global solutions dilutes the consolidated margin even while the solutions business grows profit faster in percentage terms.
In absolute terms the two segments delivered almost the same amount of incremental profit — ¥6,536 million from Integrated ICT and ¥5,707 million from Global Solutions — on revenue increases of ¥126,883 million and ¥174,566 million respectively. Global Solutions needed 38% more incremental revenue to produce 13% less incremental profit.
Regional Communications is standing still; property and energy are not
Regional Communications is the group's flat line. External revenue rose 1.9% to ¥603,603 million; total revenue rose 0.8% to ¥763,637 million, held back because inter-segment sales actually fell, to ¥160,034 million from ¥165,630 million; and segment profit rose 0.6% to ¥98,522 million. Its margin, 12.9%, is unchanged in substance from a year earlier and is the second-highest in the group. This is a business being managed for stability rather than growth, and on these numbers it is delivering exactly that.
Other — real estate and energy — is the smallest segment and the fastest-improving one. External revenue rose 27.6% to ¥244,904 million and segment profit 29.3% to ¥23,372 million, lifting its margin to 5.3% from 4.7%. That is ¥5,291 million of incremental profit, within a whisker of what either of the two big segments produced, on a revenue base roughly a third the size.
The four segments together earned ¥431,605 million, up ¥18,147 million. Inter-segment eliminations absorbed ¥6,456 million against ¥8,265 million a year earlier, adding a further ¥1,809 million and bringing the total to the reported ¥425,149 million of operating profit.
Below the operating line, equity-method income did the work — not finance income
Profit before tax rose 7.6% to ¥421,411 million, comfortably ahead of operating profit's 4.9%. The ¥9,686 million gap between those two increases is worth taking apart, because the obvious explanation — that finance income jumped — is not the right one.
Finance income did jump, to ¥43,824 million from ¥23,618 million, an increase of ¥20,206 million. But finance costs rose more, to ¥71,106 million from ¥49,281 million, an increase of ¥21,825 million. Net finance costs therefore widened, to ¥27,282 million from ¥25,663 million — a ¥1,619 million drag on the comparison, not a help. The gap comes almost entirely from one other line: share of profit of investments accounted for using the equity method nearly doubled, to ¥23,544 million from ¥12,239 million, a ¥11,305 million improvement equal to well over half of the ¥19,956 million the operating line itself contributed. Associates and joint ventures, not NTT's own treasury, are what carried pre-tax profit past the operating result.
Below pre-tax profit the direction reverses again. Income taxes were ¥137,241 million on ¥421,411 million of pre-tax profit, an effective rate of 32.6%, against ¥119,073 million on ¥391,769 million, or 30.4%, a year earlier — 2.2 percentage points more of the pre-tax pool going to tax. Profit for the period consequently rose only 4.2%, to ¥284,170 million, slower than either operating profit or pre-tax profit. Profit attributable to NTT nonetheless rose 5.8% to ¥274,830 million, because the slice going to non-controlling interests fell 28.1%, to ¥9,340 million from ¥12,982 million.
Basic earnings per share came to ¥3.38 against ¥3.14, up 7.6% — ahead of the 5.8% profit growth because the weighted-average share count fell 1.6%, to 81,423,751,267 from 82,738,469,345. That reduction is the carry-over of buybacks completed in the previous fiscal year rather than fresh repurchases: treasury shares stood at 9,125,733,186 at June 30, marginally below the 9,126,691,363 held at March 31, and the cash-flow statement records just ¥3 million spent on treasury stock in the quarter. No diluted figure is reported.
Comprehensive income attributable to NTT rose 12.2% to ¥345,754 million, well ahead of net profit, for reasons that have nothing to do with operations. A ¥52,370 million positive currency-translation adjustment, against a ¥16,336 million negative one a year earlier, plus ¥43,918 million of cash-flow-hedge gains against a ¥4,143 million loss, swung ¥116,767 million in NTT's favour — the accounting reflection of a weaker yen against the currencies in which Global Solutions earns. Pulling the other way, financial assets measured at fair value through other comprehensive income were marked down ¥28,173 million, where a year earlier they were marked up ¥66,478 million.
Capital spending outran operating cash, and NTT went straight to the bond market
Cash generated by operating activities was ¥574,494 million, up 9.2% from ¥526,255 million — growth roughly in line with operating profit plus depreciation. Against that, the group spent ¥630,294 million acquiring property, plant and equipment, intangibles and investment property, up 6.7%, taking total investing outflow to ¥673,441 million. Operating cash flow did not cover capital expenditure: the shortfall was ¥55,800 million before any other investing activity and ¥98,947 million after it. The comparable figures a year earlier were ¥64,506 million and ¥81,930 million, so the gap narrowed on the first measure and widened on the second.
Financing filled it and more. A net ¥557,107 million came in, of which ¥1,058,146 million was net short-term borrowing and ¥304,380 million new long-term debt, against ¥496,020 million of long-term repayments, ¥215,940 million of dividends to NTT shareholders, ¥81,374 million of lease repayments and ¥7,354 million of dividends to non-controlling interests. Cash and equivalents ended the quarter at ¥2,387,389 million, up ¥465,507 million in three months.
The balance sheet records the same tilt toward short-dated funding. Short-term borrowings rose ¥769,581 million to ¥5,165,229 million while long-term borrowings fell ¥226,596 million to ¥11,089,364 million. Banking deposits — NTT consolidates a banking business, which is why an ¥11 trillion deposit line sits inside a telecoms balance sheet — rose ¥411,935 million to ¥11,362,004 million. Total assets reached ¥47,459,702 million, up ¥738,443 million in the quarter; total equity ¥10,348,007 million and shareholders' equity ¥9,858,080 million, each up about 1.3%; the shareholders' equity ratio was unchanged at 20.8%; and net assets per share rose to ¥121.07 from ¥119.47.
That funding profile is the context for the single subsequent event the filing discloses. On July 1, 2026 — the day after the quarter closed — the NTT Group issued unsecured bonds in overseas markets totalling US$5.5 billion, €3.85 billion and £400 million. A multi-currency issue of that size, placed immediately after a quarter in which short-term borrowings rose by more than ¥769 billion, is consistent with terming out the short-dated funding the quarter accumulated — and, given where Global Solutions earns its revenue, with hedging overseas assets in their own currencies.
Guidance and dividend untouched — and the outlook implies the rest of the year looks nothing like the first quarter
NTT left its full-year FY2026 forecast exactly as previously announced: operating revenue of ¥15,060,000 million, up 4.5%; operating profit of ¥1,710,000 million, up 0.2%; profit before tax of ¥1,500,000 million, down 5.2%; profit attributable to NTT of ¥980,000 million, down 5.5%; and basic EPS of ¥12.10.
Set the first quarter against those numbers and the tension is plain. Q1 delivered 24.0% of the guided full-year revenue, 24.9% of guided operating profit, 28.1% of guided pre-tax profit and 28.0% of guided attributable profit. On the bottom line the quarter is running well ahead of a straight quarter-of-a-year pace — and the year as a whole is still guided to fall 5.5%. To land on ¥980,000 million, the remaining nine months must produce ¥705,170 million.
Every headline line moved in Q1 in the opposite direction from the one guidance implies for the year: revenue up 10.9% against 4.5% guided, operating profit up 4.9% against 0.2%, pre-tax profit up 7.6% against a guided 5.2% decline, attributable profit up 5.8% against a guided 5.5% decline. The filing offers no explanation because it contains none — NTT's tanshin carries no management discussion at all, referring readers instead to the results presentation held for institutional investors and analysts the same day. There were no changes to the scope of consolidation and none to accounting policies or estimates, and the quarterly statements have not been reviewed by an accounting auditor.
Two readings are available and the disclosure does not choose between them. Either the guidance is deliberately conservative and will be revised upward later in the year, or management expects identifiable pressures — the effective tax rate that has already risen 2.2 points, the finance costs that are already rising faster than finance income, and the depreciation that must eventually catch up with a data-centre build-out running at ¥630 billion a quarter — to weigh far more heavily over the remaining three quarters than they did in the first.
NTT confirmed a full-year FY2026 dividend forecast of ¥5.40 per share — ¥2.70 at the interim and ¥2.70 at the year-end — against ¥5.30 for FY2025 (¥2.65 and ¥2.65). That is a 1.9% increase and, against guided EPS of ¥12.10, a payout ratio of 44.6%. No first-quarter dividend is paid, and the forecast is unchanged from the company's previous announcement. During the quarter the group paid ¥215,940 million of dividends on the FY2025 year-end declaration.
| Metric | Q1 FY2026 | Q1 FY2025 | Change |
|---|---|---|---|
| Operating revenue (¥ million) | 3,617,707 | 3,262,039 | +10.9% |
| Total operating expenses (¥ million) | 3,192,558 | 2,856,846 | +11.8% |
| Operating profit (¥ million) | 425,149 | 405,193 | +4.9% |
| Operating margin | 11.75% | 12.42% | −0.67 pt |
| Profit before tax (¥ million) | 421,411 | 391,769 | +7.6% |
| Profit attributable to NTT (¥ million) | 274,830 | 259,714 | +5.8% |
| Comprehensive income attributable to NTT (¥ million) | 345,754 | 308,159 | +12.2% |
| Basic EPS (¥) | 3.38 | 3.14 | +7.6% |
| Integrated ICT — revenue (¥ million) | 1,617,031 | 1,490,148 | +8.5% |
| Integrated ICT — segment profit (¥ million) | 246,218 | 239,682 | +2.7% |
| Global Solutions — revenue (¥ million) | 1,278,935 | 1,104,369 | +15.8% |
| Global Solutions — segment profit (¥ million) | 63,493 | 57,786 | +9.9% |
| Regional Communications — revenue (¥ million) | 763,637 | 757,864 | +0.8% |
| Regional Communications — segment profit (¥ million) | 98,522 | 97,909 | +0.6% |
| Other (real estate, energy) — revenue (¥ million) | 442,365 | 386,042 | +14.6% |
| Other (real estate, energy) — segment profit (¥ million) | 23,372 | 18,081 | +29.3% |
| Operating cash flow (¥ million) | 574,494 | 526,255 | +9.2% |
| Purchases of fixed assets (¥ million) | 630,294 | 590,761 | +6.7% |
| Total assets (¥ million) † | 47,459,702 | 46,721,259 | +1.6% |
| Total equity (¥ million) † | 10,348,007 | 10,217,533 | +1.3% |
| Shareholders' equity (¥ million) † | 9,858,080 | 9,727,623 | +1.3% |
| Shareholders' equity ratio † | 20.8% | 20.8% | 0.0 pt |
| Net assets per share (¥) † | 121.07 | 119.47 | +1.3% |
JapanStockPulse provides informational content only and does not constitute investment advice. Figures are taken from the company's published earnings short report and may be subject to subsequent revision.