A quarter made by markets
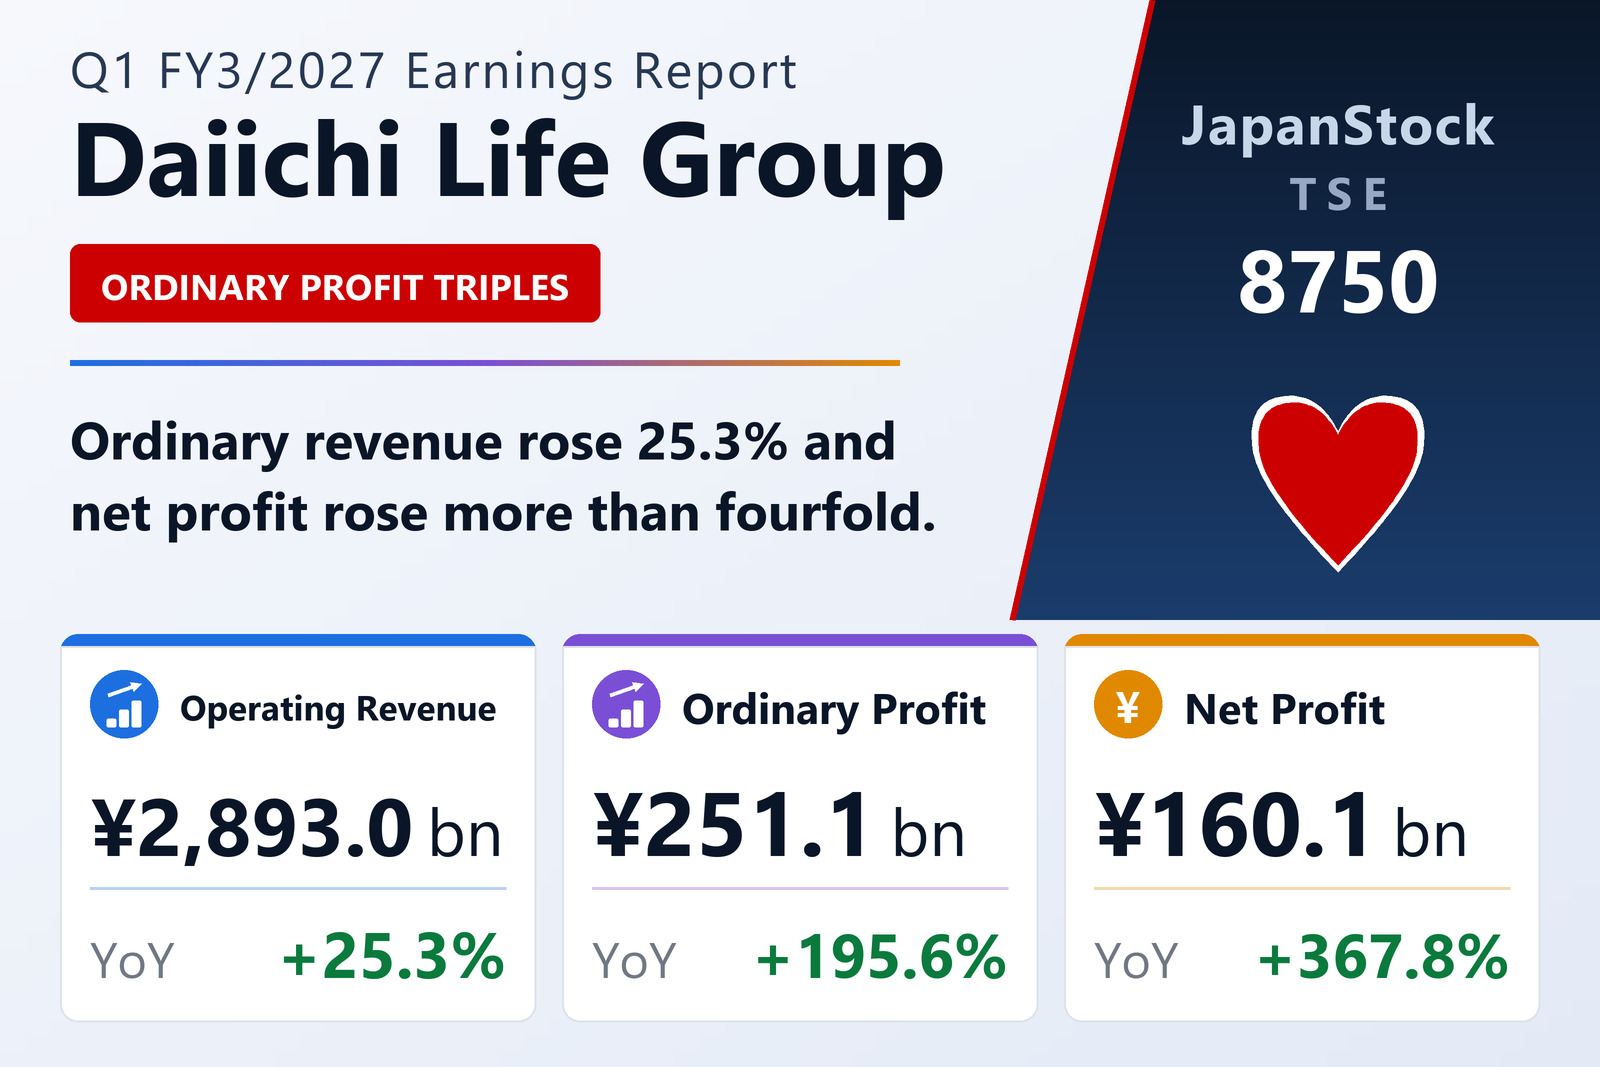
Daiichi Life Group, Inc. (TSE: 8750) published consolidated results for the three months to June 30, 2026 on August 7, 2026 under Japanese GAAP. Ordinary income rose ¥584.7 billion, or 25.3%, to ¥2,893,002 million, reversing a 22.9% decline a year earlier. Ordinary profit rose ¥166.1 billion to ¥251,057 million (+195.6%) and net profit attributable to owners of the parent ¥125.8 billion to ¥160,065 million (+367.8%).
The market backdrop explains most of it. The Bank of Japan raised its policy rate to 1.0% in June, and long-term yields rose further on caution over crude-driven inflation. Equities climbed worldwide in June as the Middle East moved toward a ceasefire and expectations for AI and semiconductor companies strengthened. For a life insurer holding ¥57.3 trillion of securities, that combination moves the income statement far more than anything in the underwriting book.
Where the ¥584.7 billion of extra income came from
Premium and other income reached ¥1,760.7 billion (+10.9%), investment income ¥1,001.3 billion (+68.3%) and other ordinary income ¥130.8 billion (+4.1%). The company attributes the increase chiefly to higher investment income at Dai-ichi Life Insurance Company. Investment income alone contributed roughly ¥406 billion of the ¥584.7 billion increase — about seven-tenths of it.
Ordinary expenses rose ¥418.5 billion, or 18.8%, to ¥2,641.9 billion. Benefits and claims paid rose 29.9% to ¥1,815.5 billion, investment expenses 35.4% to ¥341.4 billion and operating expenses 13.8% to ¥274.7 billion, while the provision for policy reserves fell 54.1% to ¥110.5 billion. Because ordinary income grew faster than ordinary expenses in absolute terms — ¥584.7 billion against ¥418.5 billion — the difference dropped through to ordinary profit.
Balance sheet
Total assets rose 2.9% to ¥76,322.7 billion. Securities, the dominant holding, rose 3.2% to ¥57,332.9 billion; loans were essentially flat at ¥4,999.5 billion; tangible fixed assets slipped 0.7% to ¥1,230.9 billion and reinsurance receivables 1.3% to ¥2,035.4 billion.
Total liabilities rose 2.6% to ¥71,749.6 billion, of which policy reserves and other insurance liabilities — the great bulk — rose 1.2% to ¥61,972.0 billion. Net assets rose 7.5% to ¥4,573.1 billion, within which net unrealised gains on available-for-sale securities rose 14.8% to ¥1,576.0 billion. That last line is the clearest single indicator of what the quarter's markets did to the balance sheet, and it is also why the equity ratio, at 6.0% against 5.7%, is not a leverage story: a life insurer's assets are policyholder reserves by construction.
Guidance unchanged
Guidance for FY3/2027 is unchanged: ordinary income of ¥10,666,000 million (−5.7%), ordinary profit of ¥869,000 million (+15.3%) and net profit of ¥513,000 million (+17.5%), for earnings per share of ¥142.44 — a figure the company notes is based on the shares outstanding and treasury holdings as at the end of June 2026.
First-quarter ordinary profit of ¥251,057 million is 28.9% of the full-year target and net profit 31.2% — modestly ahead of a level pace, but a single quarter of favourable markets tells you little about the remaining three for a business whose earnings track rates and equity prices this closely. The annual dividend forecast rises sharply, to ¥72.00 per share from ¥54.50, split ¥36.00 interim and ¥36.00 year-end.
| Metric | Q1 FY3/2027 | Q1 FY3/2026 | Change |
|---|---|---|---|
| Operating revenue (¥ million) | 2,893,002 | 2,308,294 | +25.3% |
| Ordinary profit (¥ million) | 251,057 | 84,919 | +195.6% |
| Net profit attrib. to owners of parent (¥ million) | 160,065 | 34,218 | +367.8% |
| Comprehensive income (¥ million) | 427,757 | 181,269 | +136.0% |
| EPS (¥) | 44.44 | 9.31 | +377.3% |
| Total assets (¥ million) | 76,322,711 | 74,159,096 | +2.9% |
| Net assets (¥ million) | 4,573,060 | 4,254,212 | +7.5% |
| Equity ratio | 6.0% | 5.7% | +0.3 pt |
| FY3/2027 guidance — operating revenue (¥ million) | 10,666,000 | — | −5.7% |
| FY3/2027 guidance — ordinary profit (¥ million) | 869,000 | — | +15.3% |
| FY3/2027 guidance — net profit (¥ million) | 513,000 | — | +17.5% |
| FY3/2027 guidance — EPS (¥) | 142.44 | — | n.m. |
| Annual dividend per share (¥) | 72.00 | 54.50 | +32.1% |
JapanStockPulse provides informational content only and does not constitute investment advice. Figures are taken from the company's published earnings short report and may be subject to subsequent revision.