A steep fall that is a comparison problem, not a shortfall
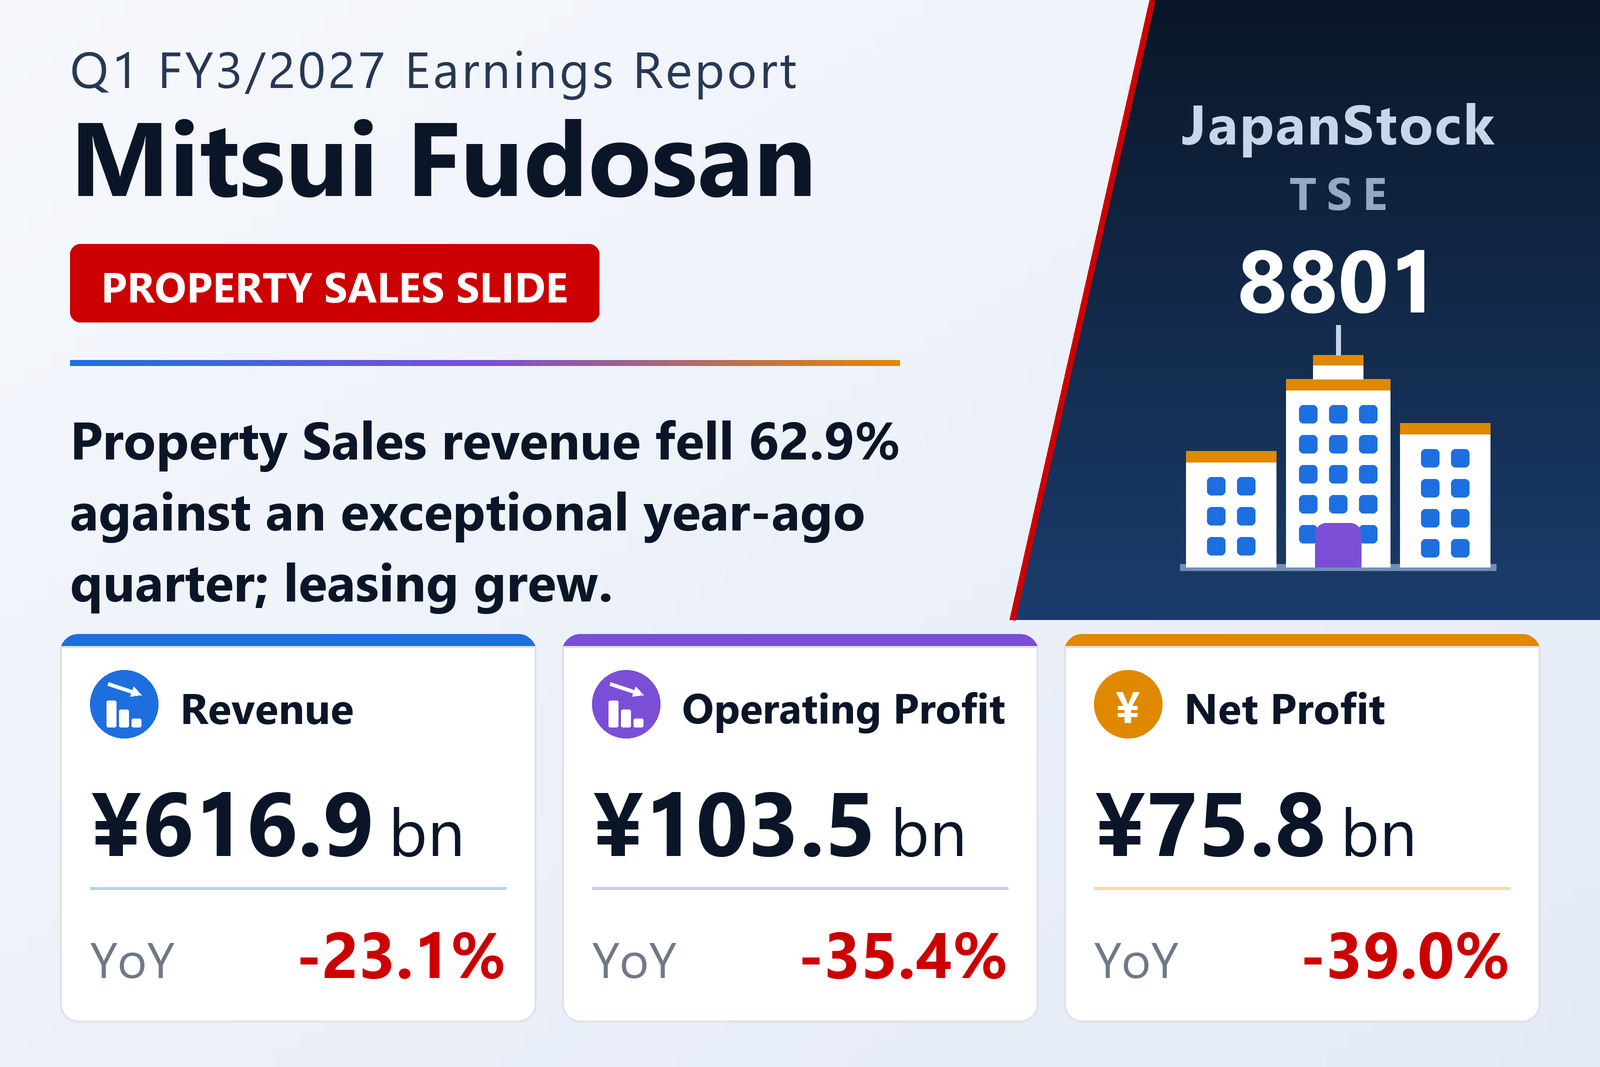
Mitsui Fudosan Co., Ltd. (TSE: 8801), Japan's largest real estate developer and the company behind the Mitsui Shopping Park and Mitsui Garden Hotels brands, published its first-quarter results for the fiscal year ending March 2027 on August 7, 2026, prepared under Japanese GAAP on a consolidated basis. Led by President and Representative Director Takashi Ueda, the group reported, for the three months from April 1 to June 30, 2026, revenue from operations of ¥616,930 million, down 23.1% from ¥802,316 million, operating profit of ¥103,507 million, down 35.4% from ¥160,112 million, ordinary profit of ¥89,493 million, down 37.9% from ¥144,005 million, and profit attributable to owners of parent of ¥75,818 million, down 39.0% from ¥124,232 million. Basic earnings per share fell to ¥28.04 from ¥44.81, with diluted EPS of ¥28.03 against ¥44.80.
The company's own preferred measure fell furthest. Business profit — defined by Mitsui Fudosan as operating profit plus equity in earnings of affiliates, including gains and losses on sales of shares of affiliates held for property sales, plus gains and losses on sales of fixed assets — dropped 44.3% to ¥104,583 million from ¥187,709 million. Comprehensive income halved, falling 49.4% to ¥56,108 million from ¥110,796 million.
What gives those percentages their size is the base. In the same quarter a year earlier every one of these lines had risen sharply: revenue was up 27.3%, operating profit up 58.1%, business profit up 79.2%, ordinary profit up 59.7% and attributable profit up 91.1%. The first quarter of the year to March 2026 was, in other words, an exceptional period, and this year's figures are being measured against it. A reader who anchors on the year-on-year column alone will conclude that Mitsui Fudosan's business deteriorated by roughly two-fifths in twelve months. The segment note says something quite different.
Property Sales: the entire decline, in one segment
The Property Sales segment — the business of developing and selling condominiums, detached housing and investor-grade buildings — reported revenue of ¥123,198 million against ¥331,789 million, a fall of 62.9%, of which external revenue was ¥123,179 million against ¥331,772 million. Its operating profit fell 67.7% to ¥31,554 million from ¥97,759 million, and its segment profit — the business-profit equivalent at segment level — fell 72.3% to ¥34,519 million from ¥124,710 million.
Two specific items explain much of the gap at the profit line. The year-ago quarter included gains on sales of fixed assets of ¥26,493 million; this year the same line contributed just ¥144 million. Working in the other direction, equity in earnings attributed to this segment rose to ¥2,820 million from ¥457 million, and a loss of ¥52 million on sales of shares of affiliates held for property sales is included in the segment this year. Strip the fixed-asset gains out of both periods and the underlying sales business still shrank heavily — but the reported ¥90,191 million reduction in segment profit is part disposal timing, not purely trading.
This is the structural point about Mitsui Fudosan that the quarter illustrates. Property-sales earnings are lumpy by construction: revenue and profit are recognised when individual condominium blocks and individual buildings complete and hand over, and those completion dates are set years in advance by construction schedules rather than by quarterly demand. A quarter in which several large hand-overs land looks spectacular; the following year's matching quarter, without them, looks like a collapse. Neither reading describes the operating business accurately on its own.
Every other segment grew — revenue and profit
Excluding Property Sales, each of Mitsui Fudosan's reportable segments increased both its top and its bottom line.
Leasing, the office and retail rental portfolio that is the group's earnings ballast, grew revenue 6.9% to ¥247,924 million from ¥231,877 million, with external revenue of ¥241,385 million against ¥226,043 million. Operating profit rose 18.9% to ¥54,704 million from ¥46,005 million — a faster rate than revenue, and evidence of operating leverage in the rental book. Segment profit rose a more modest 13.1% to ¥51,771 million; the difference is equity in earnings, which was a negative ¥2,932 million this quarter against a negative ¥240 million a year earlier.
Management — property management, brokerage and asset management — grew revenue 5.8% to ¥152,894 million (external ¥127,787 million against ¥120,158 million) and both its operating and segment profit 13.8% to ¥19,859 million from ¥17,453 million. Facility Operations, covering hotels, resorts and sports and other facilities, grew revenue 5.1% to ¥66,143 million (external ¥65,969 million) and its operating and segment profit 4.5% to ¥15,047 million from ¥14,405 million. The Other segment posted revenue of ¥66,560 million against ¥67,837 million, an operating loss of ¥1,238 million against a loss of ¥832 million, and a segment loss of ¥194 million against a profit of ¥53 million.
The arithmetic is worth stating plainly. Leasing, Management and Facility Operations between them added ¥9,055 million of segment profit year on year. Property Sales alone gave back ¥90,191 million. Adjustments deducted ¥16,419 million from operating profit against ¥14,679 million a year earlier, of which inter-segment elimination was ¥583 million (prior year ¥407 million) and unallocated corporate expenses ¥15,835 million (prior year ¥14,272 million) — the latter consisting mainly of the parent company's general and administrative expenses that are not attributable to a reportable segment. Inter-segment revenue elimination was ¥39,791 million against ¥36,648 million.
A larger balance sheet, thinner equity and a visible inventory build
Total assets rose 2.4% from the March 2026 year-end to ¥10,341,413 million, an increase of ¥237,939 million, while net assets fell 1.1% to ¥3,347,662 million from ¥3,384,844 million. Shareholders' equity fell to ¥3,244,188 million from ¥3,277,508 million. The combination pushed the equity ratio down a full point, to 31.4% from 32.4%.
The composition of the asset growth is the interesting part. Total current assets rose to ¥3,529,665 million from ¥3,245,095 million, an increase of ¥284,570 million, while total non-current assets fell to ¥6,811,748 million from ¥6,858,379 million. Within current assets, all three development-inventory lines expanded: real estate for sale rose to ¥1,417,628 million from ¥1,378,722 million, real estate for sale in process to ¥666,308 million from ¥591,214 million, and land held for development to ¥586,886 million from ¥559,200 million — together an increase of ¥141,686 million in three months. Investment securities fell to ¥1,389,685 million from ¥1,480,844 million.
That inventory build is the counterpart of the weak Property Sales quarter: stock that has not yet been sold sits on the balance sheet rather than in the income statement, and it is funded. Rising inventory alongside a falling equity ratio is the expected shape for a developer in a light hand-over quarter, and it is the line to watch across the rest of the year — the full-year plan requires those units to convert into revenue.
Thirty-seven million shares gone, and a flat book value per share
The share count changed materially during the quarter. Shares issued including treasury shares fell to 2,718,535,953 from 2,755,914,511 at the previous fiscal year-end — a reduction of 37,378,558 shares, or 1.4% — while treasury shares fell to 27,250,106 from 38,378,428. The average number of shares used for the quarter's per-share figures was 2,704,410,924, down 2.5% from 2,772,371,049 a year earlier.
The effect on book value is the clearest illustration of what a buyback and cancellation does. Shareholders' equity fell by ¥33,320 million over the three months, yet net assets per share was essentially unchanged at ¥1,205.44 against ¥1,206.06 — a decline of ¥0.62, or 0.05%. A smaller equity base spread across a proportionately smaller share count leaves the per-share figure where it was. The same mechanism cushions earnings per share: attributable profit fell 39.0%, but with 2.5% fewer average shares, basic EPS fell 37.4%.
Guidance untouched, dividend still rising to ¥37.00
Full-year guidance for the year to March 2027 is unchanged from the previously announced forecast. The company targets revenue from operations of ¥2,800,000 million, up 3.3%, operating profit of ¥410,000 million, up 3.1%, business profit of ¥450,000 million, up 1.1%, ordinary profit of ¥315,000 million, up 0.5%, and profit attributable to owners of parent of ¥285,000 million, up 2.3%, for full-year EPS of ¥105.77.
Measured against those targets, the first quarter delivered 22.0% of guided revenue, 25.2% of guided operating profit, 23.2% of guided business profit and 26.6% of guided attributable profit. Three of those four are at or above the 25% a straight-line quarter would imply, and the fourth — revenue — reflects precisely the sales-timing effect described above. That is the reconciliation between a 39% year-on-year profit decline and an untouched forecast: the quarter missed last year, not the plan.
The dividend follows the same logic. Against ¥35.00 paid for the year to March 2026 (an interim ¥17.00 plus a year-end ¥18.00), the forecast for the year to March 2027 is ¥37.00 — an interim ¥18.50 and a year-end ¥18.50, an increase of ¥2.00 — and is unrevised from the previously announced dividend forecast. A company reading its own first quarter as a shortfall does not leave a raised dividend in place.
Three notes from the accounting disclosures round out the picture. There was no significant change to the scope of consolidation, and no changes in accounting policies, changes in accounting estimates or restatements. The company does apply a special accounting treatment in preparing its quarterly statements: tax expense is computed by reasonably estimating the effective tax rate after tax-effect accounting for the full fiscal year including this quarter, and applying that rate to quarterly profit before income taxes — so the quarterly tax line is an allocation of an annual estimate rather than a discrete calculation. The attached quarterly consolidated financial statements are subject to an interim review, which is voluntary at this stage of the year. Finally, readers should note that the company prepared supplementary explanatory materials and its release explicitly directs readers to those materials for management's discussion of results rather than including narrative commentary in the earnings report itself; the analysis above therefore rests on the financial statements and the segment note.
| Metric | Q1 FY3/2027 | Q1 FY3/2026 | Change |
|---|---|---|---|
| Revenue from operations (¥ million) | 616,930 | 802,316 | −23.1% |
| Operating profit (¥ million) | 103,507 | 160,112 | −35.4% |
| Business profit (¥ million) | 104,583 | 187,709 | −44.3% |
| Ordinary profit (¥ million) | 89,493 | 144,005 | −37.9% |
| Profit attrib. to owners of parent (¥ million) | 75,818 | 124,232 | −39.0% |
| Comprehensive income (¥ million) | 56,108 | 110,796 | −49.4% |
| Basic EPS (¥) | 28.04 | 44.81 | −37.4% |
| Diluted EPS (¥) | 28.03 | 44.80 | −37.4% |
| Segment profit — Leasing (¥ million) | 51,771 | 45,764 | +13.1% |
| Segment profit — Property Sales (¥ million) | 34,519 | 124,710 | −72.3% |
| Segment profit — Management (¥ million) | 19,859 | 17,453 | +13.8% |
| Segment profit — Facility Operations (¥ million) | 15,047 | 14,405 | +4.5% |
| Segment profit — Other (¥ million) | −194 | 53 | n.m. |
| Total assets (¥ million; vs Mar 31, 2026) | 10,341,413 | 10,103,474 | +2.4% |
| Net assets (¥ million; vs Mar 31, 2026) | 3,347,662 | 3,384,844 | −1.1% |
| Equity ratio (vs Mar 31, 2026) | 31.4% | 32.4% | −1.0 pt |
| Net assets per share (¥; vs Mar 31, 2026) | 1,205.44 | 1,206.06 | −0.1% |
| Annual dividend forecast (¥) | 37.00 | 35.00 | +¥2.00 |
JapanStockPulse provides informational content only and does not constitute investment advice. Figures are taken from the company's published earnings short report and may be subject to subsequent revision.