One segment did nearly all of it
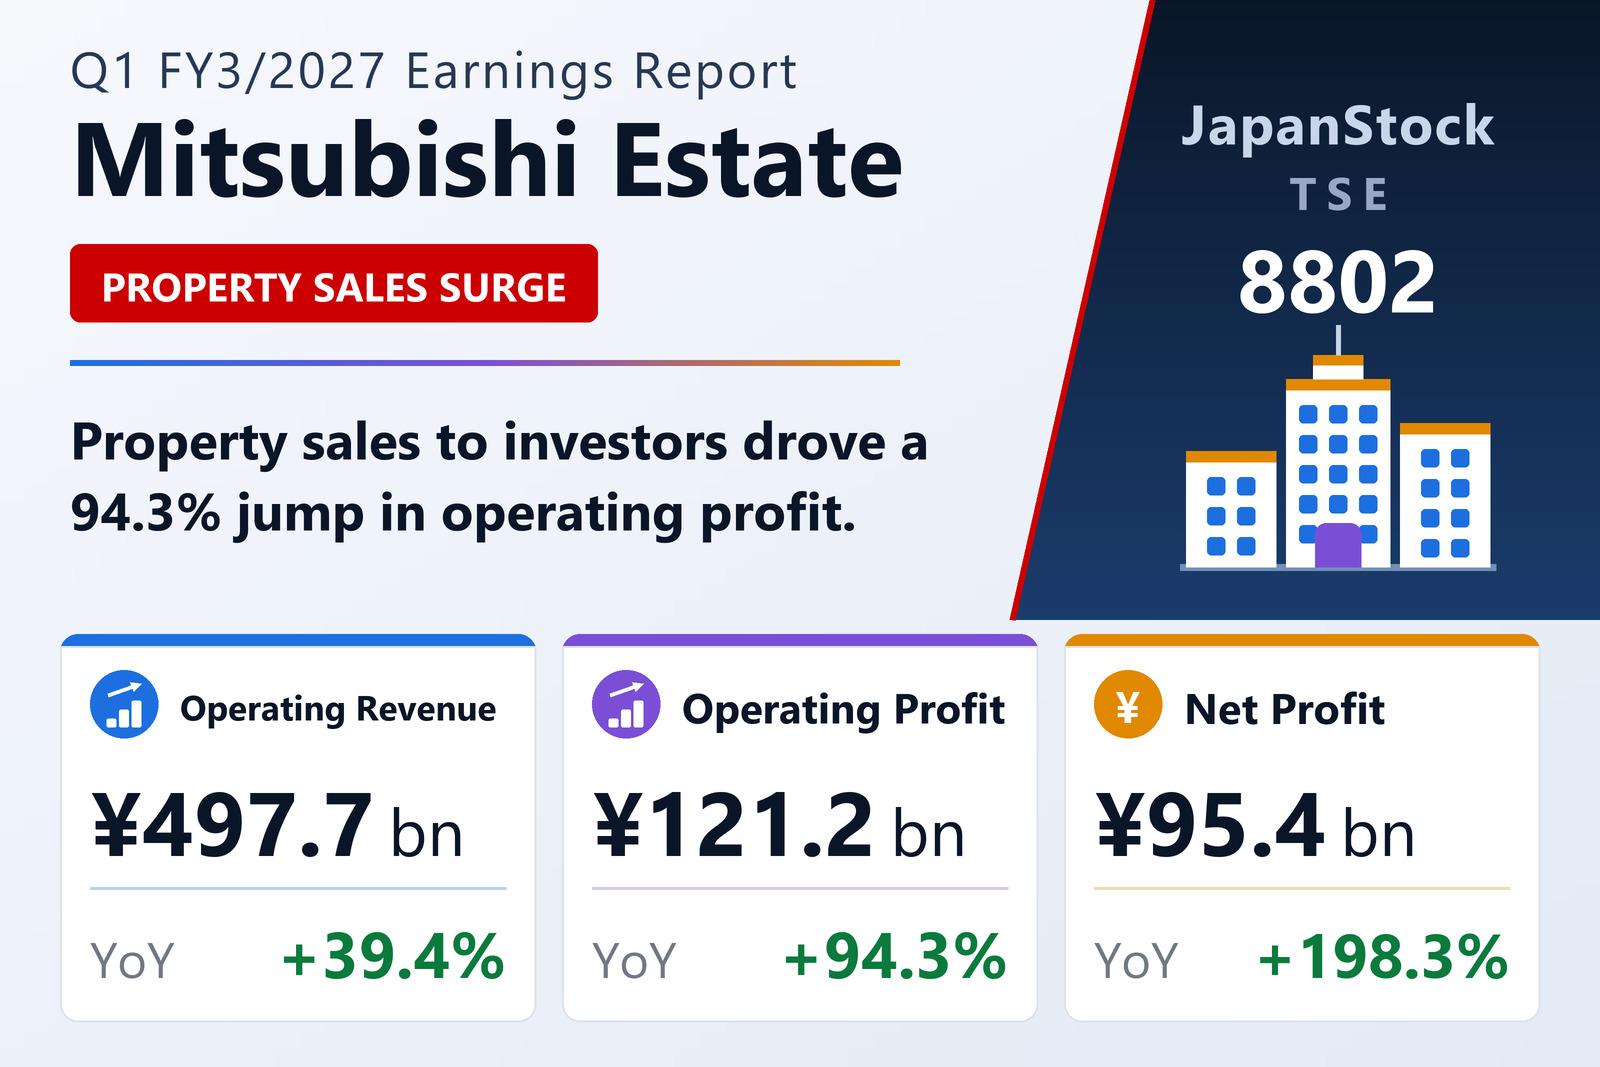
Mitsubishi Estate Co., Ltd. (TSE: 8802) published consolidated results for the three months to June 30, 2026 on August 7, 2026 under Japanese GAAP. Operating revenue rose ¥140,731 million, or 39.4%, to ¥497,685 million and operating profit ¥58,834 million, or 94.3%, to ¥121,240 million. Ordinary profit rose the same 94.3%, to ¥108,176 million.
The international segment accounts for the bulk of that. Its revenue rose 292.4% to ¥119,214 million — from ¥30,383 million — and its operating profit 575.2% to ¥43,036 million from ¥6,373 million. That single segment added ¥88.8 billion of revenue and ¥36.7 billion of profit, against group increases of ¥140.7 billion and ¥58.8 billion. Put another way, international went from 9% of segment revenue to 24%, and from 8% of segment profit to 34%.
The domestic base grew steadily underneath it
Commercial property lifted revenue 39.1% to ¥135,485 million and profit 84.4% to ¥30,027 million. Marunouchi — the district that gives the company its identity, reported as its own segment — grew revenue a steadier 4.6% to ¥101,596 million and profit 10.6% to ¥27,240 million; at ¥27.2 billion it remains the second-largest profit contributor and by far the most predictable.
Residential grew revenue 5.1% to ¥125,935 million and profit 17.4% to ¥23,305 million. Investment management grew revenue 38.1% to ¥11,195 million and profit 34.3% to ¥1,440 million. Architectural design and real estate services grew revenue 3.3% to ¥18,150 million but saw profit fall 24.4% to ¥1,412 million — the only reported segment down on profit. Other businesses narrowed their loss to ¥146 million from ¥637 million.
Below the operating line, a securities gain tripled net profit
Net profit attributable to owners of the parent rose 198.3% to ¥95,416 million, well ahead of the 94.3% at the operating line, because the extraordinary items moved sharply. This quarter carried a ¥30,228 million gain on sales of investment securities and nothing material against it; the year-earlier quarter had a ¥7,892 million securities gain offset by ¥11,491 million of fixed-asset retirement costs. Pre-tax profit was ¥138,404 million, and earnings per share ¥79.17 against ¥25.75.
Comprehensive income swung to ¥88,783 million from a loss of ¥1,249 million. Total assets edged down 0.3% from the March year-end to ¥8,542,958 million while net assets rose 1.2% to ¥2,912,852 million, lifting the equity ratio to 31.8% from 31.4%.
Guidance unchanged — and the quarter is well ahead of it
Guidance for FY3/2027 is unchanged: operating revenue of ¥2,000,000 million (+14.5%), operating profit of ¥370,000 million (+12.2%), ordinary profit of ¥295,000 million (+8.0%) and net profit of ¥235,000 million (+5.6%), for earnings per share of ¥196.27. The per-share figure allows for the share buyback resolved by the board on May 13, 2026.
First-quarter operating profit of ¥121,240 million already represents 32.8% of the full-year target and net profit 40.6% — both well above a level pace after one quarter of four. Property earnings are lumpy by nature, since a single asset sale can land in any quarter, so a fast start is not by itself a reason to expect the year to beat plan. The annual dividend forecast rises to ¥49.00 per share from ¥46.00.
| Metric | Q1 FY3/2027 | Q1 FY3/2026 | Change |
|---|---|---|---|
| Operating revenue (¥ million) | 497,685 | 356,954 | +39.4% |
| Operating profit (¥ million) | 121,240 | 62,405 | +94.3% |
| Operating margin | 24.4% | 17.5% | +6.9 pt |
| Ordinary profit (¥ million) | 108,176 | 55,672 | +94.3% |
| Net profit attrib. to owners of parent (¥ million) | 95,416 | 31,985 | +198.3% |
| Comprehensive income (¥ million) | 88,783 | −1,249 | loss to profit |
| EPS (¥) | 79.17 | 25.75 | +207.5% |
| Commercial Property — revenue (¥ million) | 135,485 | 97,414 | +39.1% |
| Commercial Property — segment profit (¥ million) | 30,027 | 16,285 | +84.4% |
| Marunouchi — revenue (¥ million) | 101,596 | 97,114 | +4.6% |
| Marunouchi — segment profit (¥ million) | 27,240 | 24,626 | +10.6% |
| Residential — revenue (¥ million) | 125,935 | 119,773 | +5.1% |
| Residential — segment profit (¥ million) | 23,305 | 19,844 | +17.4% |
| International — revenue (¥ million) | 119,214 | 30,383 | +292.4% |
| International — segment profit (¥ million) | 43,036 | 6,373 | +575.2% |
| Total assets (¥ million) | 8,542,958 | 8,566,247 | −0.3% |
| Net assets (¥ million) | 2,912,852 | 2,877,585 | +1.2% |
| Equity ratio | 31.8% | 31.4% | +0.4 pt |
| FY3/2027 guidance — operating revenue (¥ million) | 2,000,000 | — | +14.5% |
| FY3/2027 guidance — operating profit (¥ million) | 370,000 | — | +12.2% |
| FY3/2027 guidance — ordinary profit (¥ million) | 295,000 | — | +8.0% |
| FY3/2027 guidance — net profit (¥ million) | 235,000 | — | +5.6% |
| FY3/2027 guidance — EPS (¥) | 196.27 | — | n.m. |
| Annual dividend per share (¥) | 49.00 | 46.00 | +6.5% |
JapanStockPulse provides informational content only and does not constitute investment advice. Figures are taken from the company's published earnings short report and may be subject to subsequent revision.