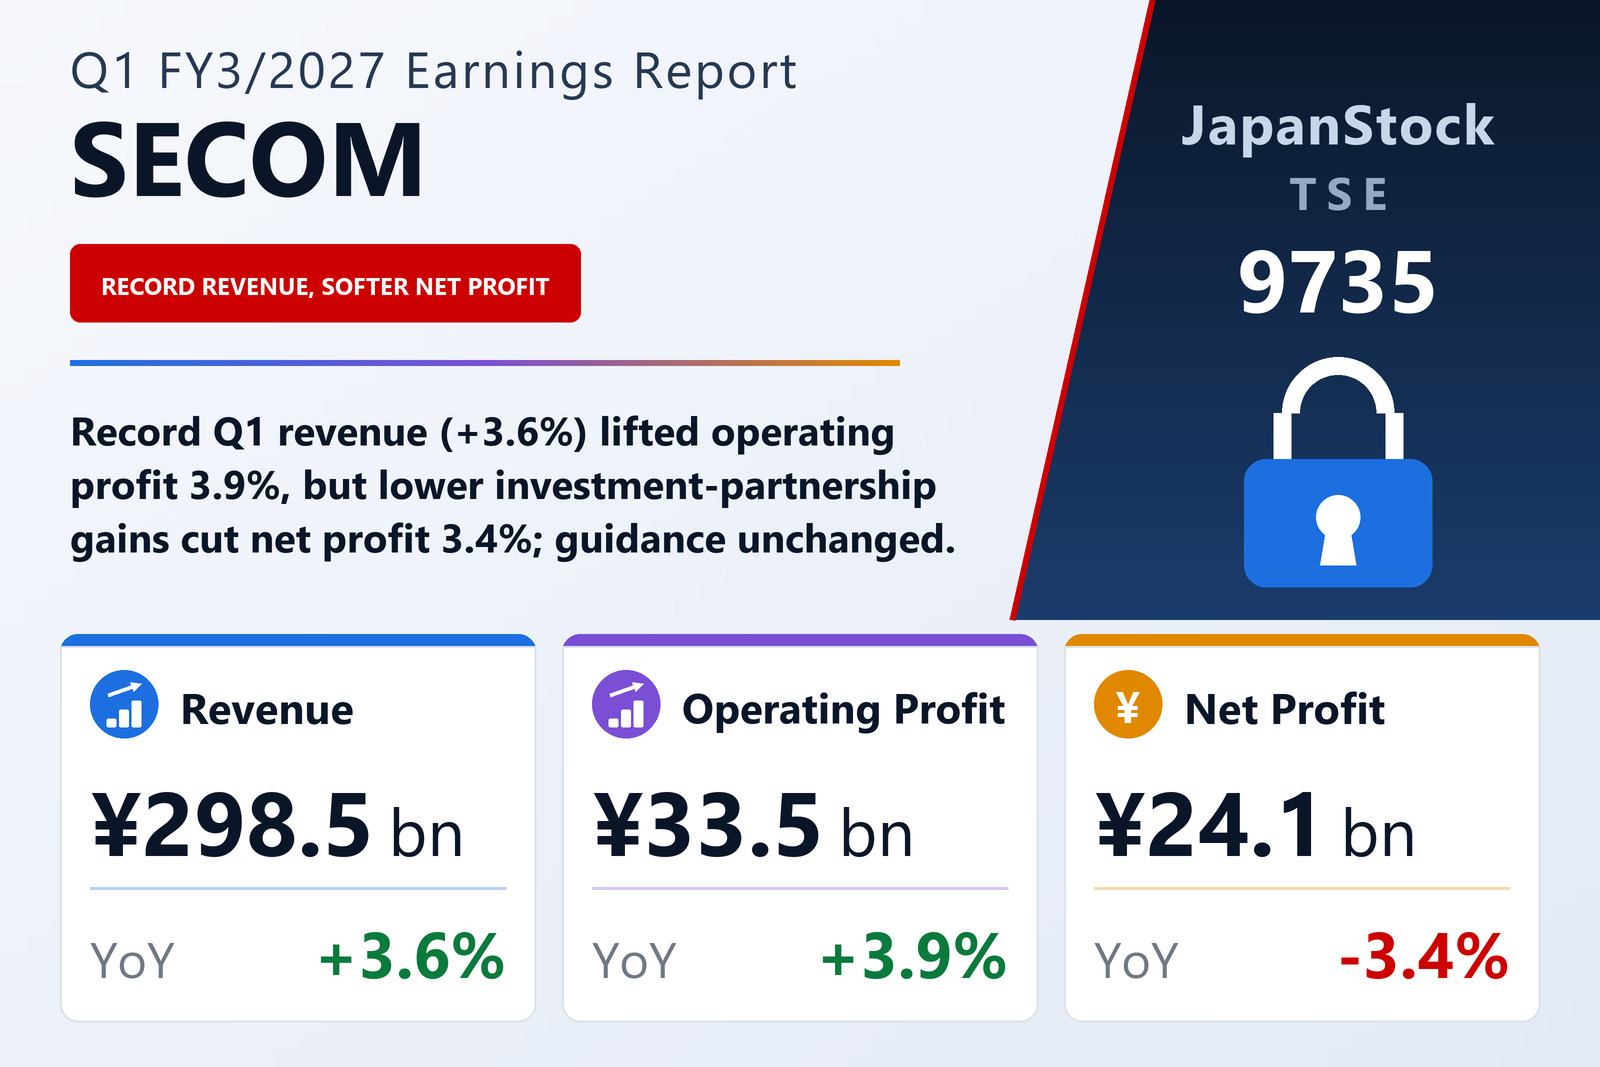
A record first quarter at the top line, with operating profit keeping pace
SECOM CO., LTD. (TSE: 9735), the Japanese group whose businesses span security services, fire protection, medical services, insurance, geospatial information and BPO & ICT, published consolidated results for the first quarter of the fiscal year ending March 2027 — April 1 to June 30, 2026 — on August 7, 2026, under Japanese GAAP. Revenue rose 3.6% to ¥298,453 million and operating profit 3.9% to ¥33,466 million, while ordinary profit fell 0.7% to ¥39,075 million and profit attributable to owners of the parent fell 3.4% to ¥24,096 million, or ¥59.81 per share against ¥60.24. The company states that first-quarter revenue was the highest on record. Its shares are listed on the Tokyo Stock Exchange.
Cost of sales rose 3.1% to ¥204,245 million, slightly slower than revenue, so gross profit grew 4.7% to ¥94,207 million and the gross margin edged up from 31.2% to 31.6%. Selling, general and administrative expenses grew faster, by 5.2% to ¥60,740 million; salaries and allowances, the largest single item, rose from ¥21,246 million to ¥22,241 million. That absorbed most of the gross-margin gain, and the operating margin stayed at 11.2% in both periods. The company attributes the revenue gain chiefly to security services and fire protection, and the operating-profit gain to the same two businesses, partly offset by lower profit in insurance.
Below the operating line, investment-partnership gains fell by ¥1,758 million
Non-operating income fell from ¥8,889 million to ¥6,723 million. The filing names the main cause: gains on investment partnerships, in the United States and elsewhere, dropped from ¥4,739 million to ¥2,981 million. Equity-method investment income also declined, from ¥2,288 million to ¥1,439 million. Non-operating expenses shrank from ¥1,774 million to ¥1,115 million, helped by the absence of the prior year's ¥645 million foreign-exchange loss, but not by enough to offset the lower income, so ordinary profit slipped 0.7% even as operating profit rose.
Extraordinary items were small on both sides: ¥164 million of gains, mainly on sales of investment securities, against ¥314 million of losses, chiefly on disposals of fixed assets. Pre-tax profit was ¥38,925 million against ¥39,183 million. Total income taxes rose from ¥12,030 million to ¥12,919 million, lifting the tax burden from about 30.7% to 33.2% of pre-tax profit; the filing does not explain the increase. Profit attributable to non-controlling interests fell from ¥2,212 million to ¥1,909 million, leaving net profit attributable to owners 3.4% lower at ¥24,096 million.
Earnings per share fell only 0.7%, because the average number of shares outstanding dropped from 414.03 million to 402.85 million as the treasury-stock holding grew. Comprehensive income nearly doubled, to ¥36,391 million from ¥18,673 million, on a ¥10,745 million increase in unrealised gains on other securities and a positive swing in foreign-currency translation adjustments.
Security services earned the most; fire protection moved the most
Security services, by far the largest segment, grew external revenue 2.1% to ¥164,040 million and segment profit 2.6% to ¥31,942 million. The filing credits steady sales of centralized (online) security systems for businesses and homes, and higher revenue at a subsidiary that mainly provides cash collection and delivery services. During the quarter the company added camera-integration features to its AZ system security for business premises, and pushed home systems including SECOM Home Security NEO, which carries facial recognition.
Fire protection revenue rose 13.9% to ¥40,038 million on higher sales of fire alarm and extinguishing systems, and segment profit jumped 411.0% to ¥1,282 million from ¥251 million, which the company attributes to a lower cost ratio on more profitable projects. The filing cautions that this business depends heavily on the construction industry and that its earnings tend to concentrate toward the fiscal year-end.
Medical services revenue rose 5.4% to ¥23,289 million, on strong sales of medical equipment and higher revenue at a general-hospital operator in India, and segment profit rose 5.8% to ¥1,678 million. Insurance revenue grew 8.2% to ¥14,893 million on steady sales of fire and auto policies, but segment profit fell 24.3% to ¥2,302 million because of higher losses from natural disasters.
Geospatial information services grew revenue 6.8% to ¥9,923 million and narrowed its operating loss to ¥1,565 million from ¥1,753 million; its main customers are government agencies whose deliveries fall mostly at the end of March, so its earnings are also back-loaded. BPO & ICT revenue fell 1.6% to ¥31,749 million, against a prior-year quarter that included strong sales of servers and other equipment and on lower revenue at its BPO subsidiary TMJ, yet segment profit rose 21.1% to ¥2,314 million on a lower cost ratio and reduced SG&A. Other businesses, which include real-estate leasing and building-equipment work, posted revenue of ¥14,517 million (−2.1%) and profit of ¥2,137 million (+9.8%). Corporate expenses not allocated to segments rose from ¥5,695 million to ¥6,246 million.
Receivables unwound after year-end, and ¥22,417 million went on buybacks
Total assets fell 2.3% to ¥2,178,656 million from March 31, 2026. The largest move was in notes and accounts receivable and contract assets, down ¥63,209 million to ¥117,716 million. Liabilities fell ¥42,113 million to ¥688,331 million, led by lower income taxes payable (¥10,641 million from ¥32,156 million), trade payables and the bonus provision, while long-term borrowings rose from ¥9,648 million to ¥16,800 million. Net assets were ¥1,490,325 million, 0.6% lower, and the equity ratio rose from 58.9% to 60.0%.
The main reason net assets fell despite the quarter's profit is share repurchases. Under a board resolution of May 12, 2026, SECOM acquired 3,510,600 of its own shares, increasing treasury stock by ¥22,417 million to ¥259,088 million. Retained earnings rose by ¥3,982 million, and unrealised gains on other securities added ¥10,491 million. The company did not prepare a quarterly cash-flow statement; depreciation for the quarter was ¥17,391 million and goodwill amortization ¥1,757 million.
Guidance and a ¥120 dividend left unchanged
SECOM left its forecasts unchanged from the figures published on May 12, 2026. For the full year to March 2027 it expects revenue of ¥1,313,500 million (+4.5%), operating profit of ¥165,500 million (+3.2%), ordinary profit of ¥176,000 million (−3.4%) and net profit attributable to owners of ¥105,800 million (−6.1%), or ¥263.57 per share. For the first half it projects revenue of ¥617,000 million (+4.0%) and operating profit of ¥68,500 million (+1.5%). The first quarter delivered 22.7% of the full-year revenue target and 20.2% of the operating-profit target.
The dividend forecast is also unchanged: ¥60 at the interim and ¥60 at the year-end, ¥120 for the year, against ¥100 (¥50 and ¥50) for the year to March 2026.
| Metric | Q1 FY3/2027 | Q1 FY3/2026 | Change |
|---|---|---|---|
| Revenue (¥ million) | 298,453 | 287,992 | +3.6% |
| Gross profit (¥ million) | 94,207 | 89,982 | +4.7% |
| Gross margin | 31.6% | 31.2% | +0.4 pt |
| SG&A expenses (¥ million) | 60,740 | 57,763 | +5.2% |
| Operating profit (¥ million) | 33,466 | 32,219 | +3.9% |
| Ordinary profit (¥ million) | 39,075 | 39,333 | −0.7% |
| Net profit attrib. to owners of parent (¥ million) | 24,096 | 24,939 | −3.4% |
| Comprehensive income (¥ million) | 36,391 | 18,673 | +94.9% |
| EPS (¥) | 59.81 | 60.24 | −0.7% |
| Security Services — revenue (¥ million) | 164,040 | 160,598 | +2.1% |
| Security Services — segment profit (¥ million) | 31,942 | 31,120 | +2.6% |
| Fire Protection — revenue (¥ million) | 40,038 | 35,138 | +13.9% |
| Fire Protection — segment profit (¥ million) | 1,282 | 251 | +411.0% |
| Medical Services — revenue (¥ million) | 23,289 | 22,106 | +5.4% |
| Medical Services — segment profit (¥ million) | 1,678 | 1,586 | +5.8% |
| Insurance — revenue (¥ million) | 14,893 | 13,762 | +8.2% |
| Insurance — segment profit (¥ million) | 2,302 | 3,043 | −24.3% |
| Geospatial Information Services — revenue (¥ million) | 9,923 | 9,291 | +6.8% |
| Geospatial Information Services — segment profit (¥ million) | −1,565 | −1,753 | loss narrowed |
| BPO & ICT — revenue (¥ million) | 31,749 | 32,272 | −1.6% |
| BPO & ICT — segment profit (¥ million) | 2,314 | 1,910 | +21.1% |
| Total assets (¥ million) | 2,178,656 | 2,230,127 | −2.3% |
| Net assets (¥ million) | 1,490,325 | 1,499,682 | −0.6% |
| Equity ratio | 60.0% | 58.9% | +1.1 pt |
| FY3/2027 guidance — revenue (¥ million) | 1,313,500 | — | +4.5% |
| FY3/2027 guidance — operating profit (¥ million) | 165,500 | — | +3.2% |
| FY3/2027 guidance — ordinary profit (¥ million) | 176,000 | — | −3.4% |
| FY3/2027 guidance — net profit (¥ million) | 105,800 | — | −6.1% |
| FY3/2027 guidance — EPS (¥) | 263.57 | — | n.m. |
| Annual dividend per share (¥) | 120.00 | 100.00 | +20.0% |
JapanStockPulse provides informational content only and does not constitute investment advice. Figures are taken from the company's published earnings short report and may be subject to subsequent revision.