Orders fell, and so did every profit line
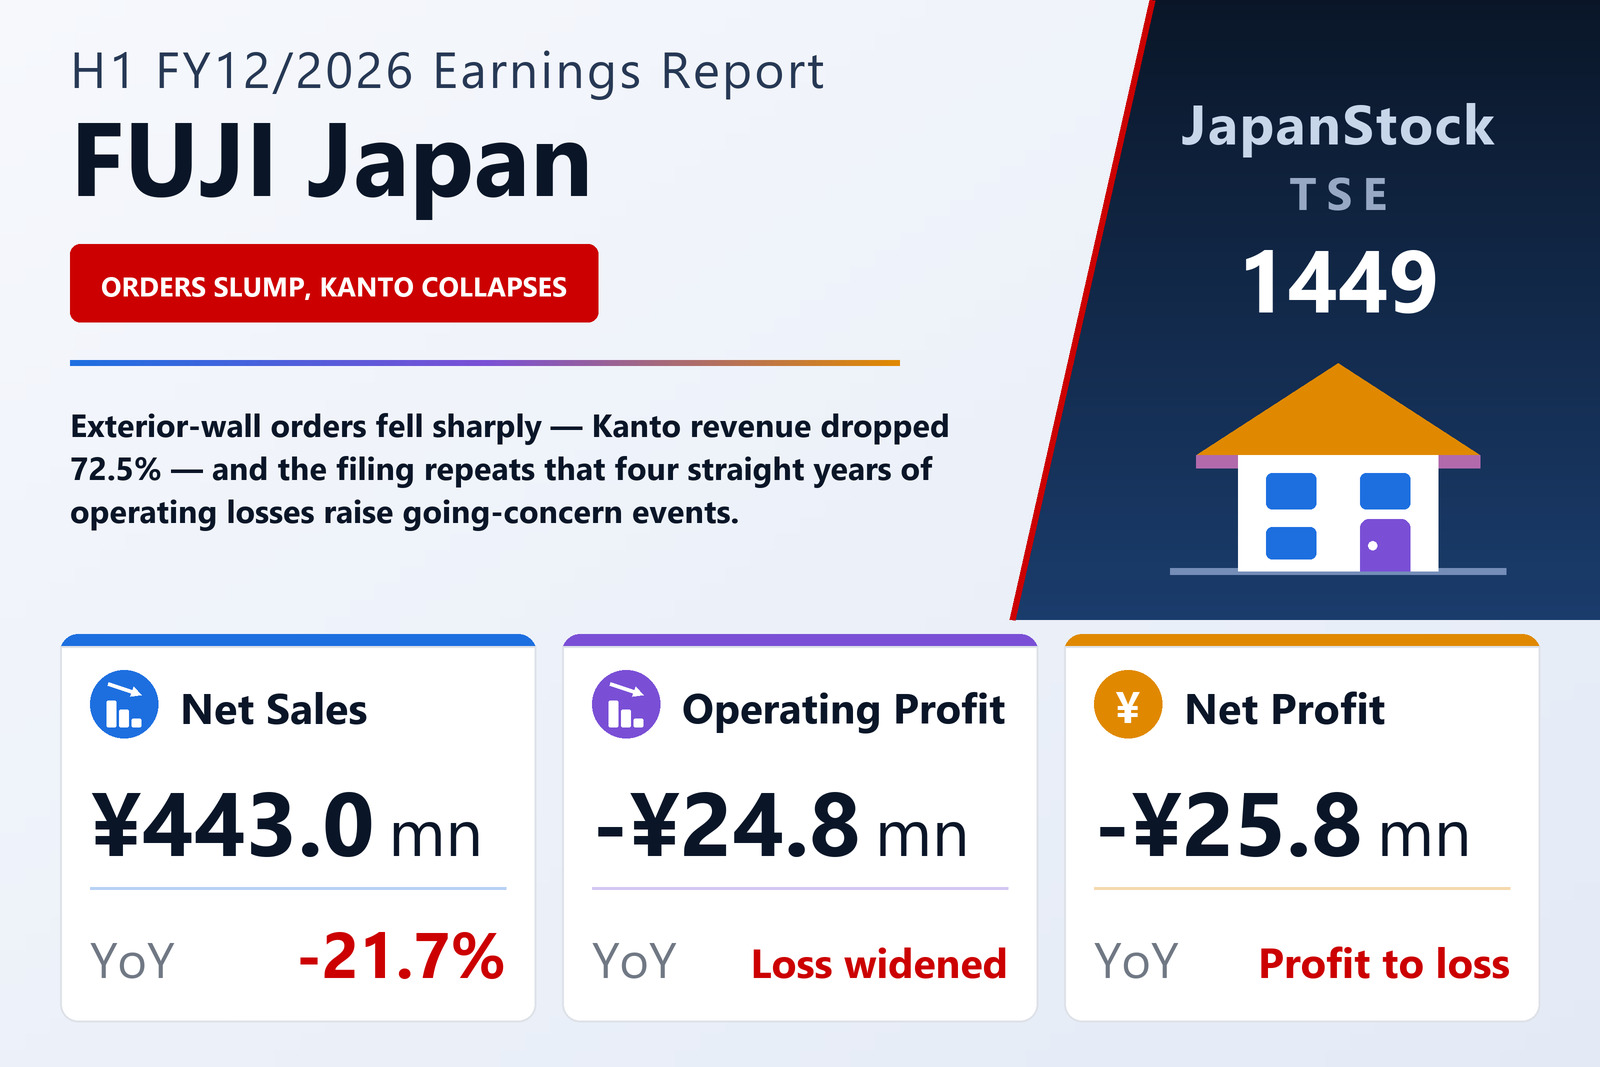
FUJI Japan Co., Ltd. (TSE: 1449) published non-consolidated interim results for FY12/2026 on August 10, 2026, covering January 1 to June 30, 2026 under Japanese GAAP. Revenue fell 21.7% to ¥443.0 million, made up of ¥409.1 million of completed-construction revenue and ¥33.8 million of materials sales. Gross profit fell 21.6% to ¥132.7 million; selling, general and administrative expenses came down 11.5% to ¥157.4 million, but not far enough, leaving an operating loss of ¥24.8 million against ¥8.7 million and an ordinary loss of ¥25.6 million against ¥10.2 million.
The bottom line is where the year-on-year comparison stops being about trading. The company reported an interim net loss of ¥25.8 million, against net income of ¥148.1 million a year earlier — but that prior-year figure rested on a ¥243.8 million gain on the sale of fixed assets, offset by ¥7.8 million of office-relocation costs. Strip the disposal out and both halves were loss-making at the ordinary line. Pre-tax result was a loss of ¥25.3 million against a ¥225.8 million profit.
Management attributed the revenue decline to a sharp fall in order intake. Government support for home renovation has raised consumer interest in the category, it said, but high construction-material prices, continued inflation and the effect of rising policy rates have depressed household sentiment, while labour shortages have grown more acute.
Kanto collapses; only the smaller businesses grow
Exterior-wall renovation, the core business, saw revenue fall 24.7% to ¥348.1 million and segment profit drop 65.4% to ¥13.2 million. The regional split shows how uneven the decline was: Hokkaido, served by the Sapporo branch, fell 11.9% to ¥229.4 million; Tohoku, served from Sendai, fell 20.3% to ¥96.4 million; and Kanto, served from Yokohama, fell 72.5% to ¥22.2 million.
The two smaller segments went the other way, or nearly so. Other renovation work grew revenue 14.3% to ¥61.1 million and segment profit 11.3% to ¥9.5 million on steady order flow from both corporate and individual customers. Materials sales fell 32.4% to ¥33.8 million with segment profit down 66.7% to ¥1.2 million. Corporate costs not allocated to any segment were ¥48.6 million, down from ¥58.8 million.
Cash down by a quarter
Total assets fell ¥40.3 million to ¥613.8 million. Current assets slipped ¥25.3 million to ¥360.5 million — cash and deposits fell ¥60.9 million and receivables ¥4.6 million, while completed-construction receivables and contract assets rose ¥39.9 million — and fixed assets eased ¥15.0 million to ¥253.2 million on depreciation. Liabilities fell ¥8.1 million to ¥277.1 million, with construction payables up ¥37.2 million against reductions in trade payables, accrued expenses, income taxes payable and long-term debt.
Net assets fell ¥32.1 million to ¥336.6 million, reflecting the interim loss and a ¥6.4 million dividend payment — a ¥3.00 per share commemorative dividend resolved on February 12, 2026. The equity ratio eased to 54.8% from 56.4%. Operating cash flow was an outflow of ¥35.8 million against ¥39.4 million a year earlier; investing was an outflow of ¥0.2 million against a ¥290.6 million inflow, which is the property sale showing up again; financing was an outflow of ¥25.0 million. Cash and equivalents ended the half at ¥124.9 million.
The going-concern note
The interim filing repeats a disclosure investors should read carefully. The company states that, having recorded operating losses for four consecutive years through the previous fiscal year, events or conditions exist that raise substantial doubt about its ability to continue as a going concern. It has been working to resolve that situation — pushing sales of its own manufactured products to win new customers, expanding repeat contracts with existing customers, and stepping up approaches to corporate customers for both materials sales and construction work — but says the situation had not been resolved as of the interim balance-sheet date.
It nonetheless concludes that no material uncertainty exists, on the grounds that its cash and deposit balance together with the credit lines it has secured from its banks leave no concern about near-term funding. Guidance for the full year is unchanged from the forecast published with the FY12/2025 results. Note that revenue at this business is seasonal: order volumes for exterior-wall work fall in winter and summer and rise in spring and autumn, so the first and third quarters are structurally the weaker ones.
| Metric | H1 FY12/2026 | H1 FY12/2025 | Change |
|---|---|---|---|
| Net sales (¥ million) | 443.0 | 565.8 | -21.7% |
| Gross profit (¥ million) | 132.7 | 169.1 | -21.6% |
| SG&A expenses (¥ million) | 157.4 | 177.8 | -11.5% |
| Operating profit (¥ million) | -24.8 | -8.7 | loss widened |
| Ordinary profit (¥ million) | -25.6 | -10.2 | loss widened |
| Pre-tax profit (¥ million) | -25.3 | 225.8 | profit to loss |
| Net profit (¥ million) | -25.8 | 148.1 | profit to loss |
| Exterior-wall renovation — revenue (¥ million) | 348.1 | 462.4 | -24.7% |
| Exterior-wall renovation — segment profit (¥ million) | 13.2 | 38.0 | -65.4% |
| Other renovation — revenue (¥ million) | 61.1 | 53.4 | +14.3% |
| Other renovation — segment profit (¥ million) | 9.5 | 8.5 | +11.3% |
| Materials sales — revenue (¥ million) | 33.8 | 50.0 | -32.4% |
| Materials sales — segment profit (¥ million) | 1.2 | 3.5 | -66.7% |
| Total assets (¥ million) | 613.8 | 654.0 | -6.2% |
| Net assets (¥ million) | 336.6 | 368.8 | -8.7% |
| Equity ratio | 54.8% | 56.4% | -1.6 pt |
JapanStockPulse provides informational content only and does not constitute investment advice. Figures are taken from the company's published earnings short report and may be subject to subsequent revision.