A better margin, not just more volume
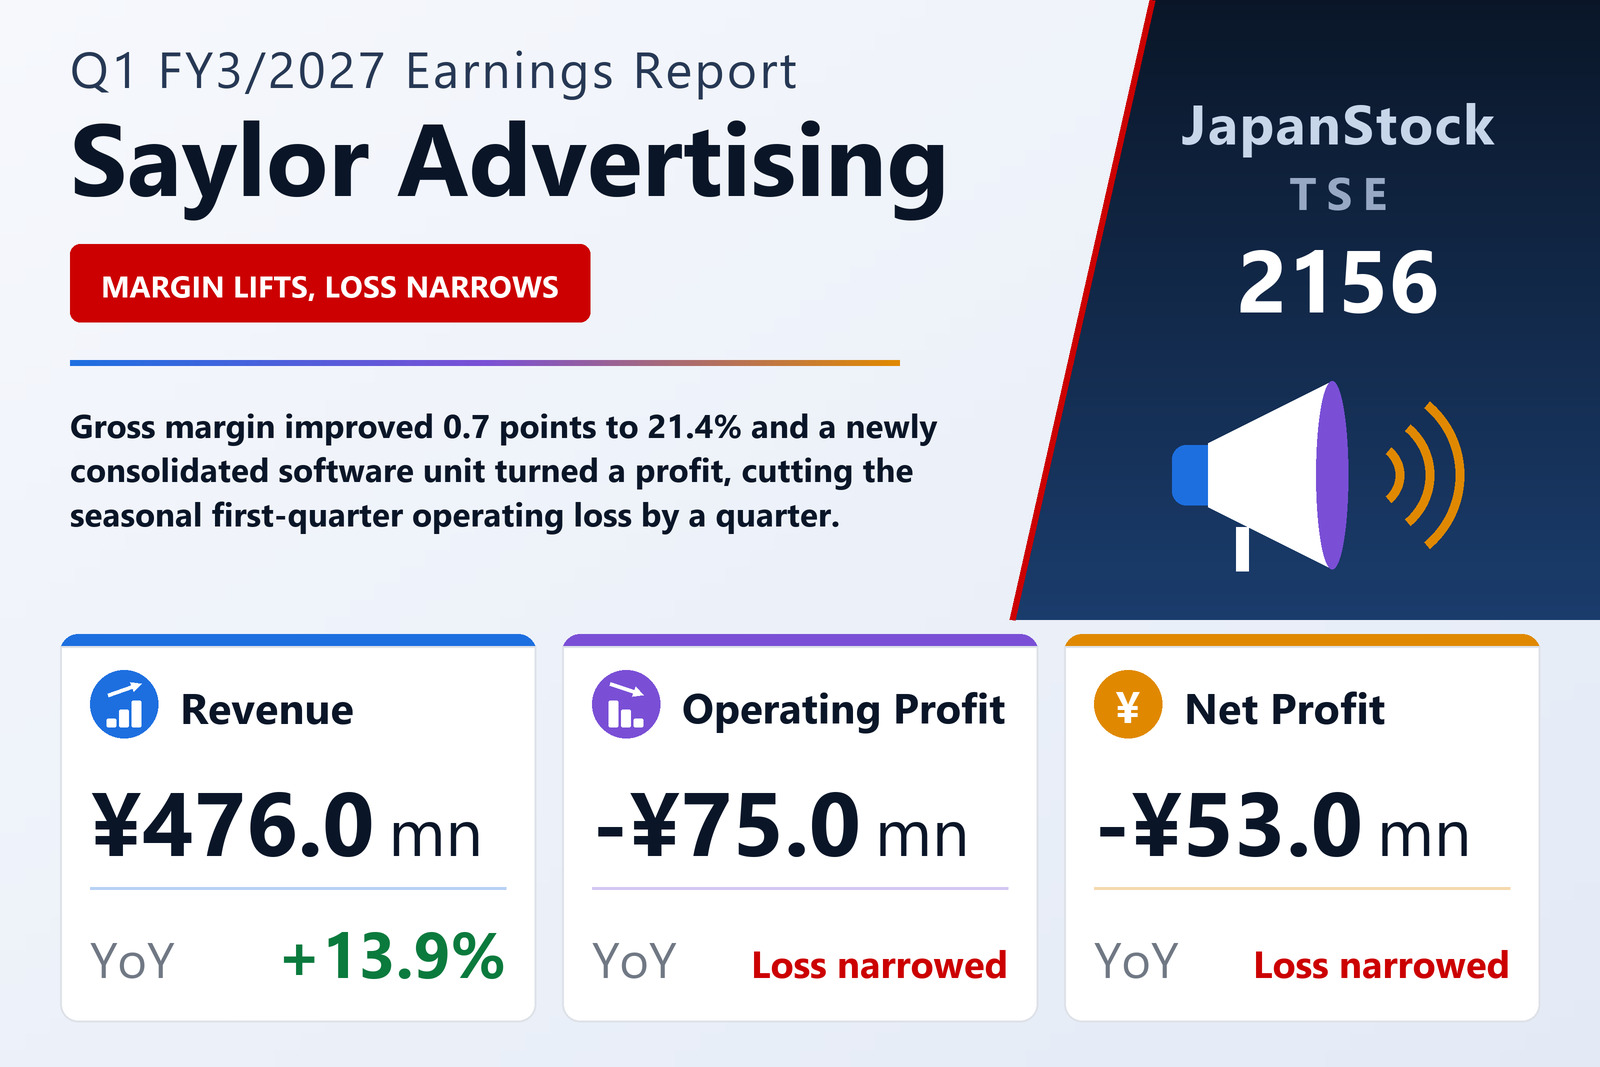
Saylor Advertising Inc. (TSE: 2156) published consolidated first-quarter results for FY3/2027 on August 10, 2026, covering April 1 to June 30, 2026 under Japanese GAAP. Gross sales — the total billings the group reports alongside its accounting revenue as a measure of business scale — rose 8.5% to ¥1,694 million. Revenue recognised under the Japanese revenue-recognition standard grew 13.9% to ¥476 million and gross profit 12.0% to ¥362 million.
The important detail is that profitability improved rather than merely scaled. Gross margin, which the company measures against gross sales, rose 0.7 points to 21.4% after what it described as a deliberate insistence on margin in day-to-day sales activity. Selling, general and administrative expenses rose only 2.6% to ¥437 million even though they now include a full quarter of costs from Fellow Co., consolidated last October, plus spending on sales training and a corporate-website rebuild. The result was an operating loss of ¥75 million against ¥102 million, an ordinary loss of ¥69 million against ¥96 million, and a net loss attributable to shareholders of ¥53 million against ¥77 million. Loss per share was ¥10.37 against ¥17.49.
Three segments, one of them brand new
Advertising, which supplies roughly 88% of recognised revenue, grew to ¥421 million from ¥405 million and cut its segment loss to ¥74 million from ¥100 million. The group won a steady flow of digital work — internet advertising and website rebuilds — and used AI tools to make its own proposal process more efficient. It also handled space-production work on a local company's R&D facility and staff-welfare building, supported subsidy-backed recruitment campaigns for regional employers, booked media placement revenue in sports marketing, and spent the quarter chasing public-sector proposal work that builds the revenue base for the rest of the year.
Retail grew revenue to ¥14 million from ¥12 million with a segment loss of ¥2 million, as the Tokushima-Kagawa Tomoni Ichiba regional-produce store held up on both footfall and takings while the group pushed Shikoku products into wider distribution. Software development appears as a segment for the first time, contributing ¥40 million of revenue and ¥1 million of segment profit on cloud funeral-hall booking systems and automated voice-response development — the only one of the three to make money in the quarter.
Borrowings up, equity ratio down
Total assets rose ¥146 million to ¥4,461 million. Current assets added ¥140 million to ¥2,345 million as cash and deposits grew and trade receivables fell, while fixed assets edged up ¥5 million to ¥2,116 million on higher deferred tax assets. Current liabilities rose ¥232 million to ¥1,619 million, with short-term borrowings up and trade payables down, and non-current liabilities eased ¥4 million to ¥618 million on long-term debt repayment.
Net assets fell ¥81 million to ¥2,223 million on the quarterly loss and the year-end dividend payment, taking the equity ratio down 3.6 points to 49.8%.
Guidance held
Saylor left the forecast published on May 14, 2026 in place: gross sales of ¥8,200 million (+4.3%), operating profit of ¥180 million and ordinary profit of ¥200 million for the year to March 2027. The company does not publish a net-profit forecast. Against a first quarter that lost ¥75 million at the operating line, the full-year target implies the remaining nine months carry the entire profit — a normal shape for a regional agency whose public-sector and event work is weighted to the second half.
The dividend forecast is unchanged at ¥6.00 per share, payable entirely at the year-end, the same as for FY3/2026.
| Metric | Q1 FY3/2027 | Q1 FY3/2026 | Change |
|---|---|---|---|
| Gross sales (¥ million) | 1,694 | 1,561 | +8.5% |
| Revenue (¥ million) | 476 | 417 | +13.9% |
| Gross profit (¥ million) | 362 | 323 | +12.0% |
| Gross margin | 21.4% | 20.7% | +0.7 pt |
| SG&A expenses (¥ million) | 437 | 426 | +2.6% |
| Operating profit (¥ million) | -75 | -102 | loss narrowed |
| Ordinary profit (¥ million) | -69 | -96 | loss narrowed |
| Net profit attrib. to owners of parent (¥ million) | -53 | -77 | loss narrowed |
| Comprehensive income (¥ million) | -50 | -68 | loss narrowed |
| EPS (¥) | -10.37 | -17.49 | loss narrowed |
| Advertising — revenue (¥ million) | 421 | 405 | +4.0% |
| Advertising — segment profit (¥ million) | -74 | -100 | loss narrowed |
| Retail — revenue (¥ million) | 14 | 12 | +14.5% |
| Retail — segment profit (¥ million) | -2 | -2 | loss narrowed |
| Software development — revenue (¥ million) | 40 | — | new |
| Software development — segment profit (¥ million) | 1 | — | new |
| Total assets (¥ million) | 4,461 | 4,315 | +3.4% |
| Net assets (¥ million) | 2,223 | 2,305 | -3.5% |
| Equity ratio | 49.8% | 53.4% | -3.6 pt |
| FY3/2027 guidance — gross sales (¥ million) | 8,200 | — | +4.3% |
| FY3/2027 guidance — operating profit (¥ million) | 180 | — | — |
| FY3/2027 guidance — ordinary profit (¥ million) | 200 | — | — |
| Annual dividend per share (¥) | 6.00 | 6.00 | unchanged |
JapanStockPulse provides informational content only and does not constitute investment advice. Figures are taken from the company's published earnings short report and may be subject to subsequent revision.