Both lines of the business went backwards
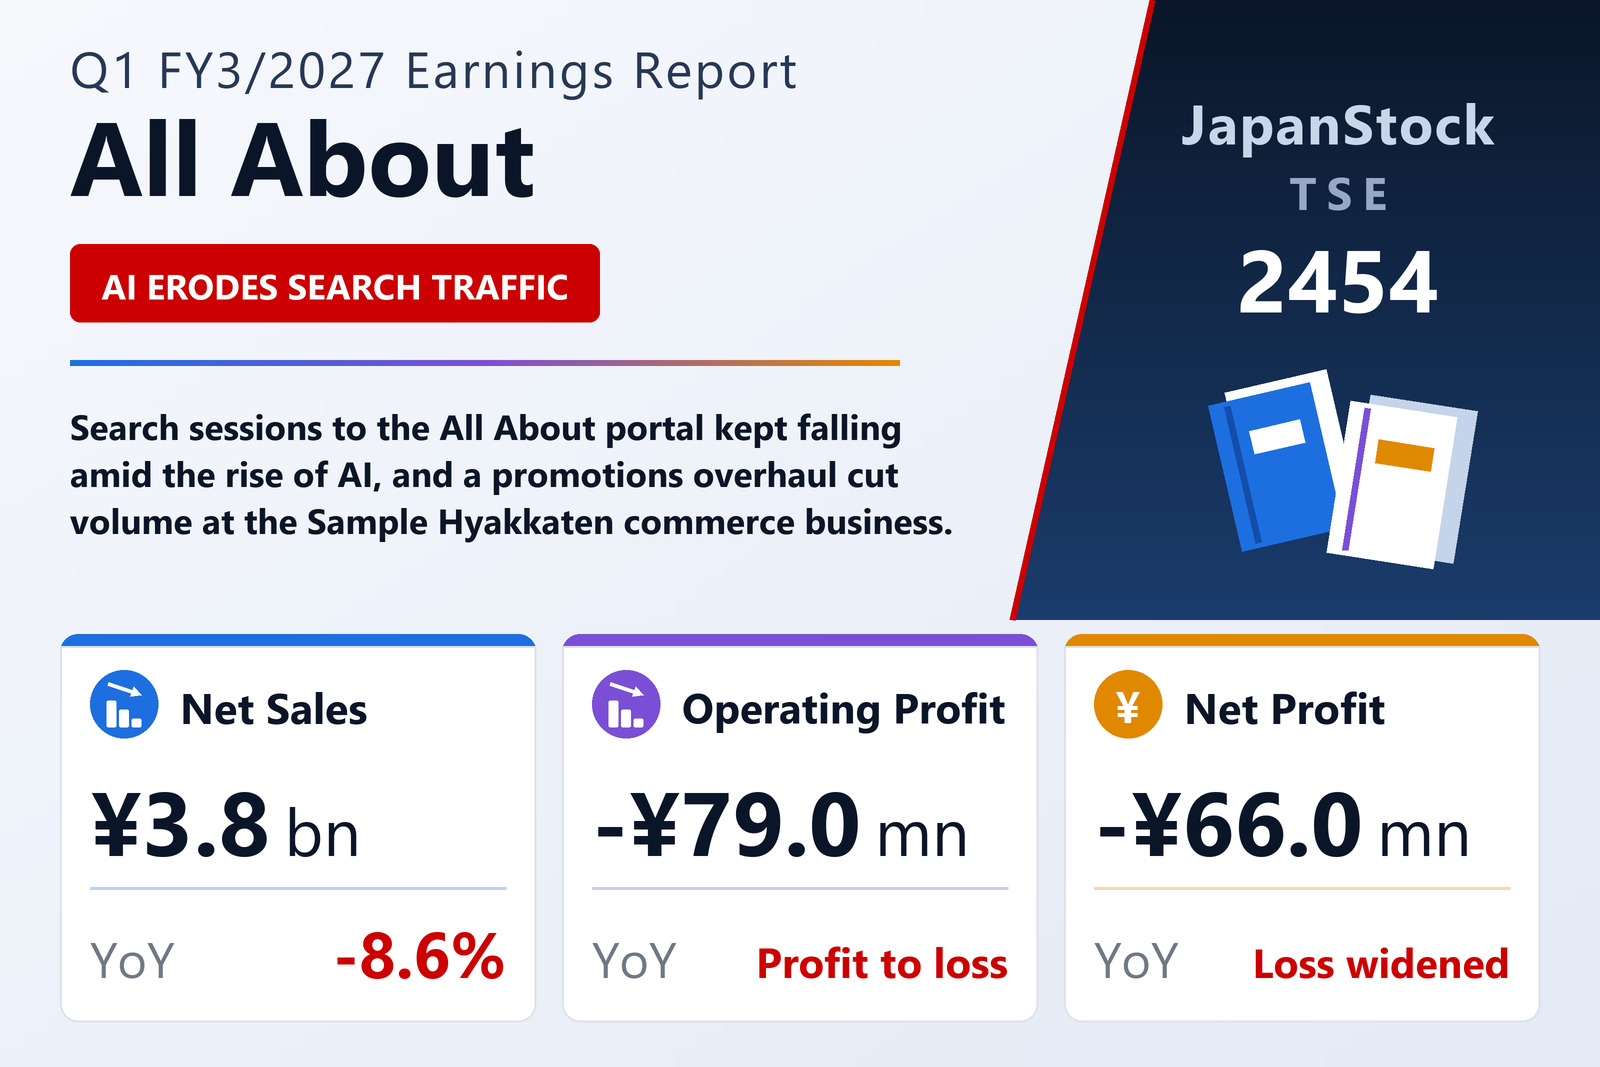
All About, Inc. (TSE: 2454) published consolidated first-quarter results for FY3/2027 on August 10, 2026, covering April 1 to June 30, 2026 under Japanese GAAP. Revenue fell 8.6% to ¥3,799 million from ¥4,155 million. The group posted an operating loss of ¥79 million and an ordinary loss of ¥71 million, against profits of ¥18 million and ¥19 million respectively a year earlier, and a net loss attributable to shareholders of ¥66 million, up from an ¥11 million loss. Loss per share was ¥4.75 against ¥0.82.
The marketing solutions segment is where the structural story sits. External revenue edged up 2.2% to ¥422 million, but the segment loss widened to ¥87 million from ¥67 million. The company said search sessions arriving at its All About general-information portal have continued to fall "amid the rise of AI and other factors" — the clearest statement yet from the group that generative search is taking traffic off its flagship property. It has responded by shifting editorial effort toward content that commands higher advertising rates, which lifted programmatic advertising revenue above the prior year; the digital marketing business also grew, but carried a heavy share of low-margin work, so the segment still lost more money than a year ago.
Alongside that, the company is trying to build revenue that does not depend on programmatic advertising at all, naming its PrimeAd platform and a financial life-support business as the vehicles for that shift.
Sampling commerce loses volume
Consumer services, which supplies 88% of group revenue, saw external revenue fall 10.6% to ¥3,344 million and segment profit halve to ¥113 million, a 53.3% decline. Product procurement at Sample Hyakkaten — one of Japan's largest try-before-you-buy services — is recovering, and the company widened its customer touchpoints by opening a storefront on Yahoo! Shopping and physical outlets including one at Ario Kawaguchi. But a reorganisation of sales-promotion programmes in the commerce area cut the value of goods transacted, and that fed straight through to revenue and profit.
A smaller balance sheet, and software spending continuing
Current assets fell ¥649 million to ¥3,517 million: cash and deposits rose ¥262 million and merchandise ¥146 million, but accounts receivable dropped ¥621 million and accrued income ¥463 million. Fixed assets rose ¥206 million to ¥3,100 million, with software in progress up ¥244 million — the group is still investing in systems even as revenue contracts. Current liabilities fell ¥368 million to ¥2,605 million, chiefly on a ¥302 million reduction in accounts payable and ¥88 million in trade payables.
Net assets slipped ¥77 million to ¥3,913 million, reflecting the quarter's loss and a ¥14 million reduction in capital surplus from the dividend paid. Because total assets fell faster, the equity ratio rose 2.2 points to 52.8%. Net assets per share were ¥247.88 against ¥253.63.
Guidance unchanged — and it points to a loss-making year
All About left the forecast published with its FY3/2026 results on May 13, 2026 in place. For the six months to September it guides to revenue of ¥7,400 million (−6.3%), an operating loss of ¥130 million and an ordinary loss of ¥130 million, with a net loss of ¥400 million and a loss per share of ¥28.46.
The full-year shape is unusual. The company expects revenue of ¥15,600 million (+0.9%), operating profit of ¥20 million and ordinary profit of ¥10 million — both barely above break-even — but a net loss of ¥700 million and a loss per share of ¥49.80. In other words, a year guided to make a small operating profit is also guided to end with a substantial bottom-line loss, which implies material charges below the ordinary-profit line. The dividend forecast is nil for the interim; the company's articles set both the half-year and the year-end as dividend record dates, but it says the year-end amount is undecided. It paid ¥1.00 per share for FY3/2026.
| Metric | Q1 FY3/2027 | Q1 FY3/2026 | Change |
|---|---|---|---|
| Net sales (¥ million) | 3,799 | 4,155 | -8.6% |
| Operating profit (¥ million) | -79 | 18 | profit to loss |
| Ordinary profit (¥ million) | -71 | 19 | profit to loss |
| Net profit attrib. to owners of parent (¥ million) | -66 | -11 | loss widened |
| Comprehensive income (¥ million) | -63 | -9 | loss widened |
| EPS (¥) | -4.75 | -0.82 | loss widened |
| Marketing solutions — revenue (¥ million) | 422 | 413 | +2.2% |
| Marketing solutions — segment profit (¥ million) | -87 | -67 | loss widened |
| Consumer services — revenue (¥ million) | 3,344 | 3,741 | -10.6% |
| Consumer services — segment profit (¥ million) | 113 | 242 | -53.3% |
| Total assets (¥ million) | 6,617 | 7,060 | -6.3% |
| Net assets (¥ million) | 3,913 | 3,990 | -1.9% |
| Equity ratio | 52.8% | 50.6% | +2.2 pt |
| FY3/2027 guidance — revenue (¥ million) | 15,600 | — | +0.9% |
| FY3/2027 guidance — operating profit (¥ million) | 20 | — | — |
| FY3/2027 guidance — ordinary profit (¥ million) | 10 | — | — |
| FY3/2027 guidance — net profit (¥ million) | -700 | — | — |
| FY3/2027 guidance — EPS (¥) | -49.80 | — | — |
JapanStockPulse provides informational content only and does not constitute investment advice. Figures are taken from the company's published earnings short report and may be subject to subsequent revision.