Almost all the profit growth came from the service book
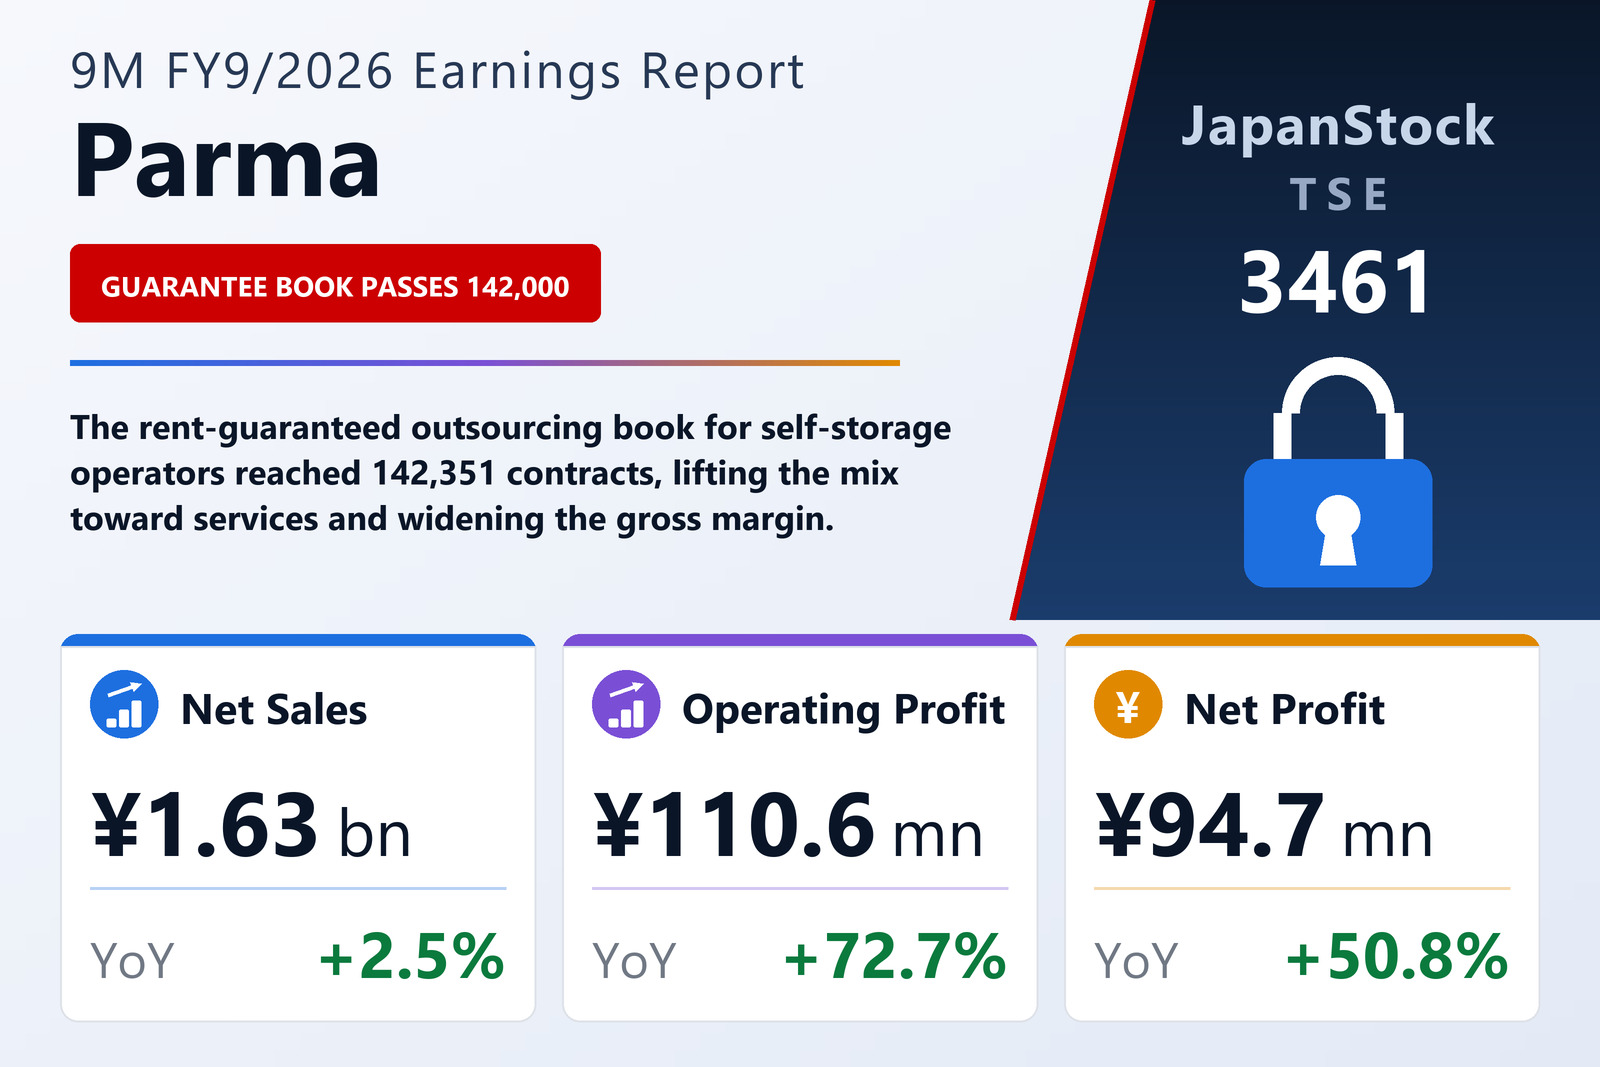
Parma Co., Ltd. (TSE: 3461) published non-consolidated results for the first nine months of FY9/2026 on August 10, 2026, covering October 1, 2025 to June 30, 2026 under Japanese GAAP. Revenue rose 2.5% to ¥1,634.0 million, but gross profit grew four times as fast — up 9.6% to ¥764.1 million — because the mix shifted toward the higher-margin service business. With selling, general and administrative expenses up only 3.2% to ¥653.5 million, operating profit jumped 72.7% to ¥110.6 million.
Ordinary profit rose 47.1% to ¥147.7 million, held above operating profit by ¥47.4 million of non-operating income against ¥10.3 million of non-operating expenses. A ¥2.1 million loss on retirement of fixed assets took pre-tax profit to ¥145.6 million, and net profit finished 50.8% higher at ¥94.7 million.
Business solutions: the recurring half
Business solution services — rent-guaranteed business process outsourcing for self-storage operators, plus IT services — grew revenue 7.1% to ¥1,162.3 million and segment profit 11.3% to ¥411.3 million. Existing operators switched to Parma's service and at least one large operator adopted it for the first time, while underlying self-storage demand stayed firm. New contracts signed during the nine months came to 31,899, up 8.4%, and the outstanding book of rent-guaranteed BPO contracts reached 142,351 at the end of June, 5.1% above the previous year-end.
The company also widened the service's reach: it introduced operational support at Tokyo Denki Yochi, extended its arrears-guaranteed collection service and its Clarice web booking, payment and inventory system into the serviced-office market, and joined Area Link's partner scheme, which lets Parma supply rent-guaranteed BPO to the Hello Storage network Area Link operates.
Turnkey: smaller, and less loss-making
Turnkey solution services — developing storage facilities and lifting occupancy at the ones it runs — saw revenue fall 7.2% to ¥471.7 million, but the segment loss narrowed to ¥158.4 million from ¥175.7 million. Parma pushed development support for companies wanting to make use of idle land, Tokyo Denki Yochi among them.
It also signed a business tie-up with JB Sustainable to install and operate grid-scale batteries, using unused space at the container-type storage sites Parma owns or manages alongside JB Sustainable's know-how — an early-stage idea, but one that would put a second revenue stream on land the company already controls.
Inventory and debt both moved
Current assets rose ¥42.7 million to ¥3,594.7 million. The composition changed more than the total: real estate held for sale rose ¥646.1 million and subrogation receivables ¥116.7 million, while cash and deposits fell ¥294.9 million, real estate in progress fell ¥278.6 million and the allowance for doubtful accounts increased ¥102.3 million. Fixed assets rose ¥8.5 million to ¥247.6 million on higher deferred tax assets. Total assets ended at ¥3,842.3 million, ¥51.2 million higher than at the September year-end.
The debt profile lengthened. Current liabilities fell ¥242.4 million to ¥571.4 million as short-term borrowings came down ¥205.0 million, while non-current liabilities rose ¥280.1 million to ¥836.7 million on a ¥279.5 million increase in long-term borrowings. Net assets rose ¥13.5 million to ¥2,434.3 million — the ¥94.7 million of net profit less ¥81.2 million of dividends paid — for an equity ratio of 63.3%. Parma left its full-year targets for FY9/2026 unchanged.
| Metric | 9M FY9/2026 | 9M FY9/2025 | Change |
|---|---|---|---|
| Net sales (¥ million) | 1,634.0 | 1,593.8 | +2.5% |
| Gross profit (¥ million) | 764.1 | 697.3 | +9.6% |
| SG&A expenses (¥ million) | 653.5 | 633.3 | +3.2% |
| Operating profit (¥ million) | 110.6 | 64.0 | +72.7% |
| Ordinary profit (¥ million) | 147.7 | 100.4 | +47.1% |
| Pre-tax profit (¥ million) | 145.6 | 100.4 | +45.0% |
| Net profit (¥ million) | 94.7 | 62.8 | +50.8% |
| Business solution services — revenue (¥ million) | 1,162.3 | 1,085.6 | +7.1% |
| Business solution services — segment profit (¥ million) | 411.3 | 369.7 | +11.3% |
| Turnkey solution services — revenue (¥ million) | 471.7 | 508.2 | -7.2% |
| Turnkey solution services — segment profit (¥ million) | -158.4 | -175.7 | loss narrowed |
| Total assets (¥ million) | 3,842.3 | 3,791.2 | +1.3% |
| Net assets (¥ million) | 2,434.3 | 2,420.8 | +0.6% |
| Equity ratio | 63.3% | — | — |
JapanStockPulse provides informational content only and does not constitute investment advice. Figures are taken from the company's published earnings short report and may be subject to subsequent revision.