Firm prices carry the domestic crop
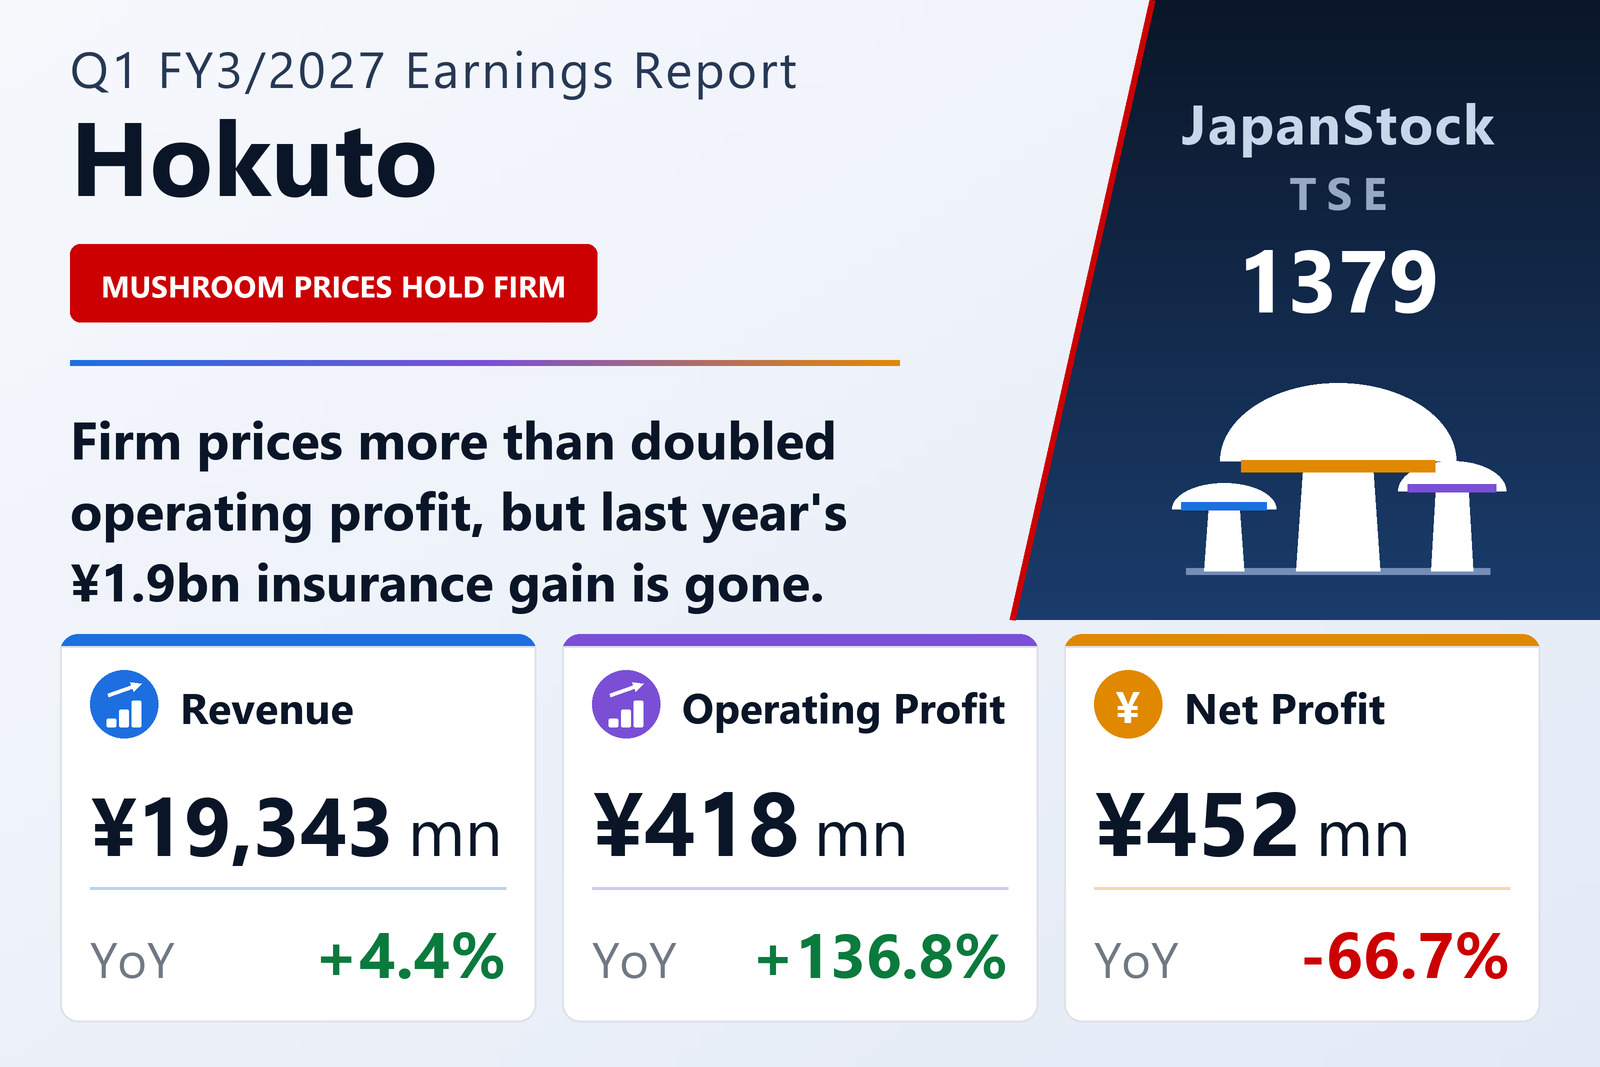
Hokuto Corporation (TSE: 1379) published consolidated first-quarter results for FY3/2027 on August 12, 2026, covering April 1 to June 30, 2026 under Japanese GAAP. Net sales rose 4.4% to ¥19,343 million, gross profit 6.3% to ¥4,645 million and operating profit 136.8% to ¥418 million, with selling, general and administrative expenses almost flat at ¥4,227 million against ¥4,191 million.
Domestic mushrooms, which supply roughly five-eighths of group sales, lifted revenue 2.6% to ¥12,095 million and segment profit 47.7% to ¥673 million. Management attributed the improvement to firm mushroom prices after the Golden Week holidays, when poor weather kept vegetable markets tight, alongside continued cost reduction in cultivation. Group production volumes were slightly lower: bunashimeji including the Bunapy variety came to 10,695 tonnes (−1.0%), eryngii 3,877 tonnes (−5.9%) and maitake 3,516 tonnes (−4.9%). In May the company took a majority stake in Funagata Mushroom Ltd, the third-largest button-mushroom grower in Japan, to broaden its range.
Overseas mushrooms give back most of last year's profit
The overseas business was the quarter's weak point, holding revenue almost flat at ¥1,820 million (−0.1%) while segment profit fell 64.2% to ¥82 million. In the United States, HOKTO KINOKO COMPANY saw consumption soften as petrol prices rose on Middle East tensions, and lost a tender to a customer that had previously bought directly; it did begin supplying part of the Kroger group's territory. In Taiwan, a large customer cancelled a planned promotion and a collapse in vegetable prices left the local subsidiary carrying excess inventory that had to be cleared at promotional prices. The Malaysian unit came in below plan on sales but cut its operating loss sharply.
The two smaller segments both improved. Processed foods grew revenue 6.3% to ¥1,779 million and segment profit 138.4% to ¥39 million on strong food-service and delicatessen demand, a recovery in convenience-store sales and rapid growth in retort products sold online. Chemical and industrial materials — packaging, industrial and agricultural materials — added 12.7% of revenue at ¥3,647 million and 74.5% of profit at ¥188 million after price revisions were passed through to customers to offset higher purchase costs.
Why net profit fell while ordinary profit multiplied
The gap between the operating and net lines is entirely non-operating and one-off. Below operating profit, a ¥207 million foreign-exchange loss a year ago became a ¥106 million gain, lifting non-operating income to ¥405 million from ¥226 million while non-operating expenses fell to ¥45 million from ¥255 million — enough to take ordinary profit to ¥777 million from ¥147 million. Extraordinary income, however, was just ¥2 million against ¥1,898 million a year earlier, when the company booked ¥1,896 million of insurance proceeds relating to a fire, alongside a ¥56 million fire loss. Earnings per share were ¥14.44 against ¥43.43.
Total assets rose ¥2,003 million to ¥115,729 million, split between ¥984 million of current assets and ¥1,018 million of fixed assets. Liabilities grew ¥2,423 million to ¥51,225 million, chiefly on ¥4,003 million of short-term borrowings and ¥1,122 million of accrued payables against a ¥2,438 million reduction in income taxes payable. Net assets slipped 0.6% to ¥64,504 million and the equity ratio eased to 55.7% from 57.1%.
Guidance held, dividend forecast raised
Hokuto left the forecast published on May 15, 2026 in place. For the year to March 2027 it expects net sales of ¥88,100 million (+2.5%), operating profit of ¥7,260 million (+3.3%), ordinary profit of ¥7,650 million (−6.6%) and net profit of ¥5,250 million (−25.1%), for earnings per share of ¥167.22. The first half is guided to ¥38,900 million of sales, ¥110 million of operating profit and a net loss of ¥94 million — a reminder that Hokuto's profit is concentrated in the colder second half, when mushroom demand peaks.
The dividend forecast is ¥62.00 per share for the year, made up of a ¥10.00 interim and a ¥52.00 year-end payment, against ¥55.00 paid for FY3/2026. That is a 12.7% increase, and it too is unchanged from the May forecast.
| Metric | Q1 FY3/2027 | Q1 FY3/2026 | Change |
|---|---|---|---|
| Net sales (¥ million) | 19,343 | 18,524 | +4.4% |
| Gross profit (¥ million) | 4,645 | 4,368 | +6.3% |
| Operating profit (¥ million) | 418 | 176 | +136.8% |
| Ordinary profit (¥ million) | 777 | 147 | +426.1% |
| Net profit attrib. to owners of parent (¥ million) | 452 | 1,358 | -66.7% |
| Comprehensive income (¥ million) | 973 | 2,108 | -53.8% |
| EPS (¥) | 14.44 | 43.43 | -66.7% |
| Domestic mushrooms — revenue (¥ million) | 12,095 | 11,790 | +2.6% |
| Domestic mushrooms — segment profit (¥ million) | 673 | 456 | +47.7% |
| Overseas mushrooms — revenue (¥ million) | 1,820 | 1,822 | -0.1% |
| Overseas mushrooms — segment profit (¥ million) | 82 | 231 | -64.2% |
| Processed foods — revenue (¥ million) | 1,779 | 1,674 | +6.3% |
| Processed foods — segment profit (¥ million) | 39 | 16 | +138.4% |
| Chemical & industrial materials — revenue (¥ million) | 3,647 | 3,237 | +12.7% |
| Chemical & industrial materials — segment profit (¥ million) | 188 | 107 | +74.5% |
| Total assets (¥ million) | 115,729 | 113,726 | +1.8% |
| Net assets (¥ million) | 64,504 | 64,924 | -0.6% |
| Equity ratio | 55.7% | 57.1% | -1.4 pt |
| FY3/2027 guidance — revenue (¥ million) | 88,100 | — | +2.5% |
| FY3/2027 guidance — operating profit (¥ million) | 7,260 | — | +3.3% |
| FY3/2027 guidance — ordinary profit (¥ million) | 7,650 | — | -6.6% |
| FY3/2027 guidance — net profit (¥ million) | 5,250 | — | -25.1% |
| FY3/2027 guidance — EPS (¥) | 167.22 | — | — |
| Annual dividend per share (¥) | 62.00 | 55.00 | +12.7% |
JapanStockPulse provides informational content only and does not constitute investment advice. Figures are taken from the company's published earnings short report and may be subject to subsequent revision.