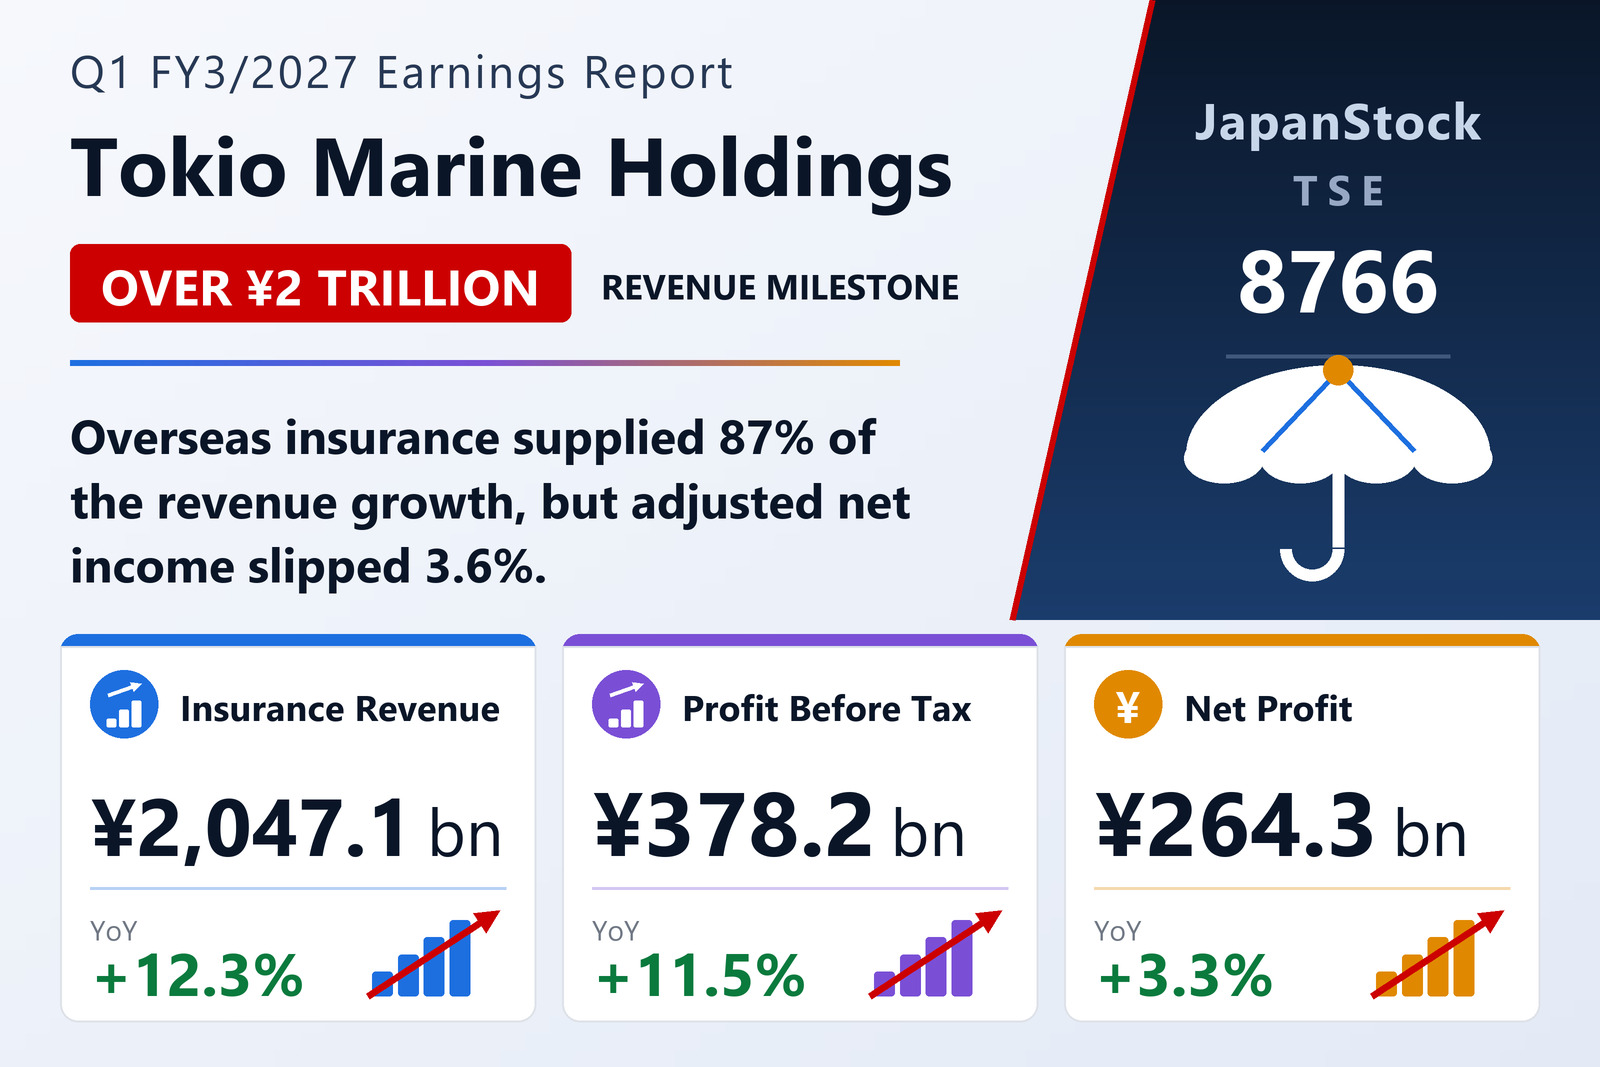
Insurance revenue clears ¥2 trillion in a single quarter
Tokio Marine Holdings, Inc. (TSE: 8766), Japan's largest property and casualty insurance group, reported consolidated results for the first quarter of the year to March 2027 — April 1 to June 30, 2026 — under IFRS. Insurance revenue rose 12.3% to ¥2,047,134 million, or ¥2.05 trillion, an increase of ¥224,352 million year on year. Profit before tax climbed 11.5% to ¥378,167 million, profit for the period rose 7.6% to ¥286,886 million, and profit attributable to owners of parent gained 3.3% to ¥264,300 million. Basic earnings per share came in at ¥138.25 against ¥133.49 a year earlier, with diluted EPS of ¥138.16 against ¥133.38. Total comprehensive income more than doubled, up 103.0% to ¥375,382 million.
Underneath the headline, the underwriting result and the investment result both improved. The insurance service result rose 11.5% to ¥351,684 million, built from insurance revenue of ¥2,047,134 million less insurance service expenses of ¥1,569,450 million and a net reinsurance loss of ¥125,999 million. The financial result advanced 26.1% to ¥154,078 million: the investment result jumped to ¥421,757 million from ¥300,518 million, with interest income of ¥204,946 million, other investment gains of ¥233,829 million and investment expenses of ¥17,018 million, while net insurance finance expenses widened to ¥267,679 million from ¥178,335 million. General and administrative expenses rose 13.3% to ¥191,968 million. The results were disclosed on August 12, 2026, and the attached quarterly financial statements were not subject to review by a certified public accountant or audit corporation.
The macro backdrop the company describes is a resilient one. The global economy absorbed higher energy prices caused by heightened tensions in the Middle East, but was underpinned by vigorous AI-related capital investment centred on the United States. In Japan, government energy support measures and progress in securing alternative supply kept the slowdown limited.
Why IFRS profit rose and the group's own measure fell
The most interesting line in the release is one that IFRS does not define. Adjusted net income fell 3.6% to ¥261,351 million, ¥9,710 million lower than a year earlier, and adjusted EPS eased to ¥137 from ¥141. Tokio Marine defines adjusted net income as profit attributable to owners of parent less capital gains and losses, less ALM and hedge-related gains and losses, and less business-investment-related gains and losses — the amortisation of intangibles arising on business investments and impairments of goodwill and intangibles. It is explicitly not an IFRS measure; the company discloses it because it considers it useful to investors, and from this quarter it is also the profit measure used for segment reporting.
The arithmetic makes the divergence easy to see. This quarter, profit attributable to owners of parent of ¥264,300 million had an ALM and hedge-related gain of ¥21,368 million deducted, while a capital loss of ¥8,009 million and business-investment-related losses of ¥10,410 million were added back, leaving ¥261,351 million. A year earlier, ¥255,959 million had a capital gain of ¥2,714 million deducted and ALM and hedge-related losses of ¥9,085 million plus business-investment-related losses of ¥8,731 million added back, leaving ¥271,061 million. The single largest mover is ALM and hedging: a ¥9,085 million loss became a ¥21,368 million gain, a swing of ¥30,453 million that flows straight into the IFRS line and is excluded from the underlying one. Read that way, the quarter is the mirror image of its headline — an IFRS profit flattered by asset-liability management, and an underlying result that went backwards.
The overseas book is now three-fifths of the group
From this quarter the group reorganised its reportable segments, moving from four — domestic property and casualty insurance, domestic life insurance, international insurance, and solutions and other — to three: domestic insurance, international insurance and solutions. The segment profit measure changed at the same time, from profit attributable to owners of parent to adjusted net income. Prior-year comparatives have been restated on the new basis, so the figures below are like for like.
The domestic business grew its top line and lost ground on profit. Domestic insurance revenue rose 2.9% to ¥832,754 million while its adjusted net income fell 14.9% to ¥98,820 million. Inside that segment — disclosed for reference rather than as reportable units — domestic property and casualty insurance revenue rose 3.2% to ¥767,689 million with adjusted net income down 20.8% to ¥77,238 million, while domestic life insurance revenue slipped 1.1% to ¥65,065 million but adjusted net income rose 16.2% to ¥21,581 million. The domestic life contractual service margin stood at ¥1,147.0 billion, ¥2.6 billion lower than at March 31, 2026.
International insurance did the heavy lifting. Its insurance revenue rose 18.9% to ¥1,225,818 million — close to ¥1.23 trillion, and 59.5% of the ¥2,058,573 million reportable-segment total — and its adjusted net income rose 9.2% to ¥164,333 million, now 62% of the segment aggregate. Of the group's ¥224,352 million increase in consolidated insurance revenue, ¥194,570 million, or 87%, came from overseas. The solutions segment, which spans consulting, investment advisory, investment trust management and nursing care, saw other revenue fall 8.5% to ¥61,324 million and adjusted net income drop to ¥1,477 million from ¥2,928 million. On a pre-tax basis, domestic insurance contributed ¥159,491 million (up from ¥138,162 million) and international ¥211,783 million (up from ¥195,444 million).
A ¥33.7 trillion balance sheet, and a currency-driven doubling of comprehensive income
Total assets stood at ¥33,676,978 million at June 30, 2026, up ¥674,327 million, or 2.0%, from ¥33,002,651 million at March 31. Total equity rose ¥270,774 million to ¥8,323,145 million, of which equity attributable to owners of parent was ¥8,197,310 million, up from ¥7,955,554 million, lifting the ratio of equity attributable to owners to 24.3% from 24.1%. Cash and cash equivalents grew to ¥2,790,959 million from ¥2,332,406 million, investment securities to ¥21,217,232 million from ¥21,062,726 million, and insurance contract liabilities to ¥20,543,844 million from ¥20,219,118 million. Retained earnings reached ¥7,237,467 million from ¥7,013,113 million, while treasury stock fell to ¥232,715 million from ¥304,160 million as the treasury share count dropped to 34,005,955 from 55,487,168 against 1,934,000,000 shares issued. No quarterly consolidated cash flow statement was prepared; depreciation and amortisation for the quarter was ¥49,055 million against ¥40,207 million.
The doubling of comprehensive income is a story about the yen and about discount rates, not about underwriting. Other comprehensive income swung to a positive ¥88,495 million from a negative ¥81,804 million. The dominant item was foreign currency translation of overseas operations, a gain of ¥88,131 million against a loss of ¥124,236 million a year earlier — a swing of ¥212,367 million that reflects the exchange rate rather than the business. Insurance contract discount rate movements added ¥79,407 million against ¥56,459 million, and reinsurance contract discount rate movements cost ¥14,245 million against ¥9,680 million. Working the other way, debt instrument valuations cost ¥77,044 million against ¥68,488 million, equity instrument gains shrank to ¥20,081 million from ¥66,096 million, and cash flow hedges turned to a ¥7,930 million loss from a ¥1,116 million gain.
Guidance held, and a ¥245 dividend
Tokio Marine left its full-year forecast unchanged from its previous announcement. For the year to March 2027 it guides to profit attributable to owners of parent of ¥830,000 million, up 56.2%, for basic EPS of ¥441.83, and to adjusted net income of ¥950,000 million, up 7.8%, for adjusted EPS of ¥514. The first quarter therefore represents 31.8% of the IFRS profit target and 27.5% of the adjusted target — a comfortable start against the reported line, a slightly slower one against the measure management steers by.
The dividend continues to climb. Against FY3/2026's actual payout of ¥105.50 at the interim and ¥112.50 at the year-end, ¥218.00 in total, the group forecasts ¥122.50 and ¥122.50 for a full-year ¥245.00 in FY3/2027, an increase of 12.4% and unchanged from the dividend forecast published previously. There were no significant changes in the scope of consolidation during the quarter, no changes in accounting policies or accounting estimates required by or beyond IFRS, no going-concern note, and no note on material changes in equity attributable to owners of parent.
| Metric | Q1 FY3/2027 | Q1 FY3/2026 | YoY |
|---|---|---|---|
| Insurance revenue (¥ million) | 2,047,134 | 1,822,782 | +12.3% |
| Insurance service result (¥ million) | 351,684 | 315,288 | +11.5% |
| Financial result (¥ million) | 154,078 | 122,183 | +26.1% |
| Profit before tax (¥ million) | 378,167 | 339,189 | +11.5% |
| Profit for the period (¥ million) | 286,886 | 266,683 | +7.6% |
| Profit attrib. to owners of parent (¥ million) | 264,300 | 255,959 | +3.3% |
| Adjusted net income (¥ million; non-IFRS) | 261,351 | 271,061 | −3.6% |
| Basic EPS (¥) | 138.25 | 133.49 | +3.6% |
| Diluted EPS (¥) | 138.16 | 133.38 | +3.6% |
| Adjusted EPS (¥; non-IFRS) | 137 | 141 | −2.8% |
| Total comprehensive income (¥ million) | 375,382 | 184,878 | +103.0% |
| Domestic insurance — insurance revenue (¥ million) | 832,754 | 809,417 | +2.9% |
| Domestic insurance — adjusted net income (¥ million) | 98,820 | 116,133 | −14.9% |
| International — insurance revenue (¥ million) | 1,225,818 | 1,031,248 | +18.9% |
| International — adjusted net income (¥ million) | 164,333 | 150,527 | +9.2% |
| Total assets (¥ million; vs Mar 31, 2026) | 33,676,978 | 33,002,651 | +2.0% |
| Equity attrib. to owners of parent (¥ million) | 8,197,310 | 7,955,554 | +3.0% |
| Ratio of equity attrib. to owners | 24.3% | 24.1% | +0.2 pt |
| FY3/2027 guidance — profit attrib. to owners (¥ million) | 830,000 | — | +56.2% |
| FY3/2027 guidance — adjusted net income (¥ million) | 950,000 | — | +7.8% |
| Annual dividend per share (¥; FY3/27 forecast vs FY3/26 actual) | 245.00 | 218.00 | +12.4% |
JapanStockPulse provides informational content only and does not constitute investment advice. Figures are taken from the company's published earnings short report and may be subject to subsequent revision.