One division carries the nine months
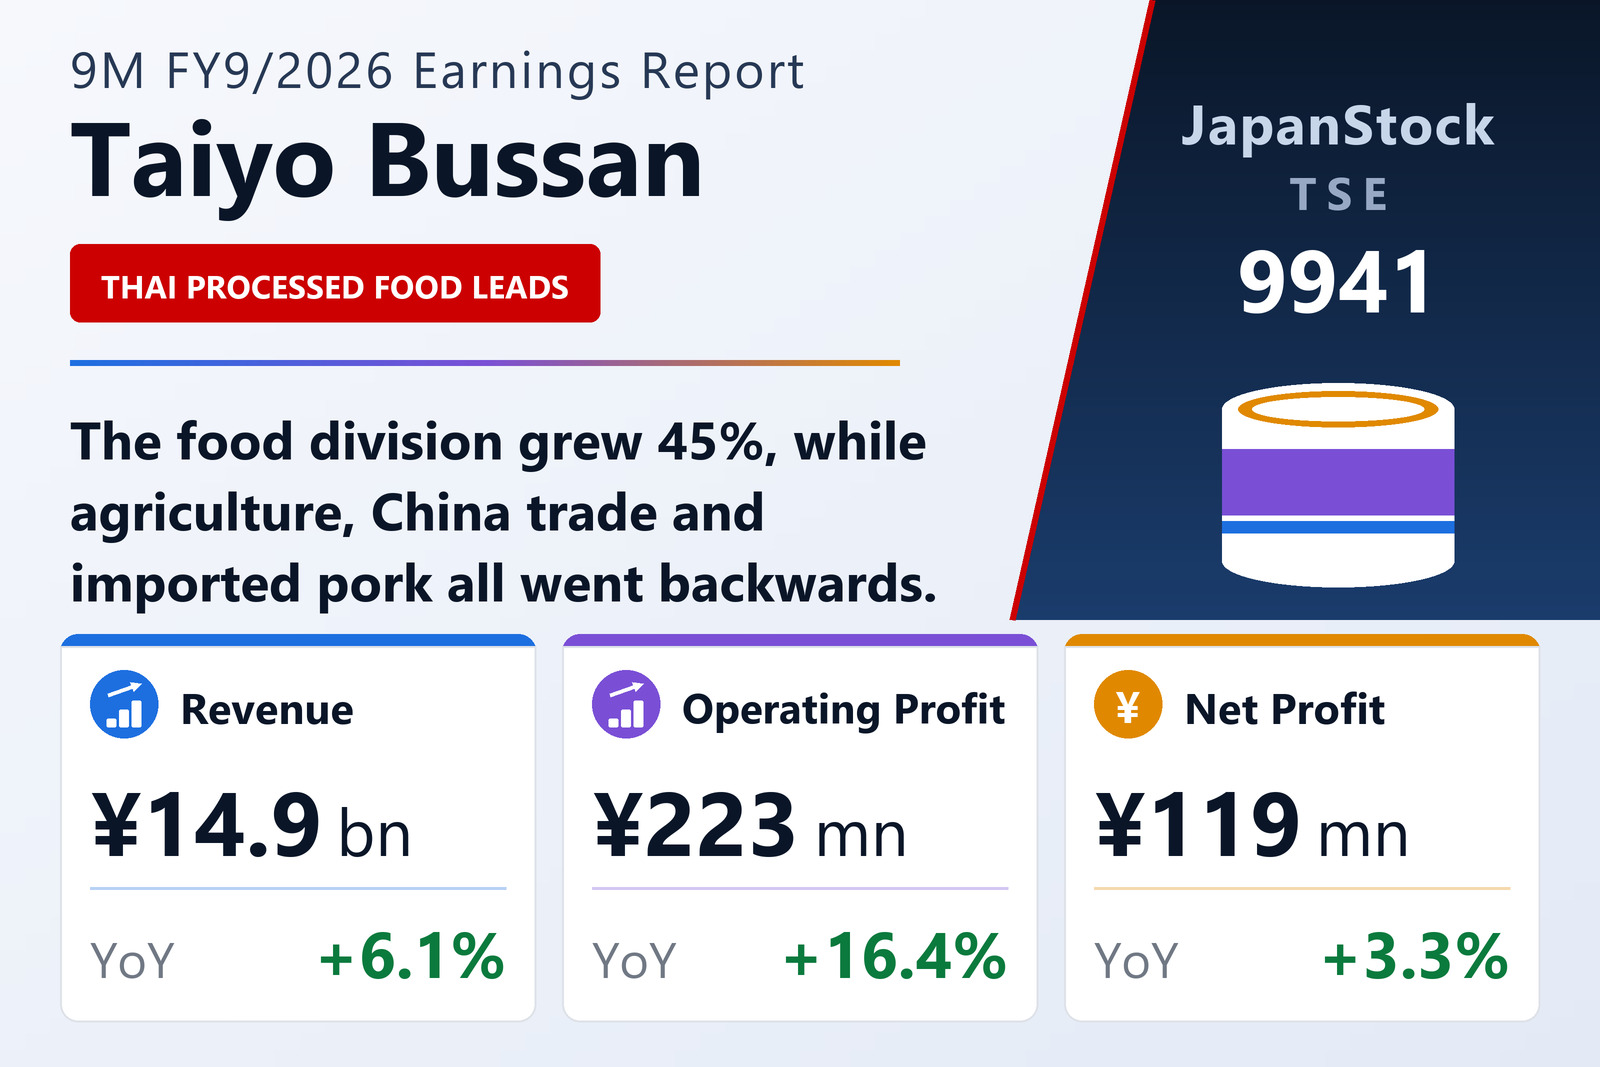
Taiyo Bussan Co., Ltd. (TSE: 9941) published non-consolidated results for the nine months to June 30, 2026 on August 12, 2026 under Japanese GAAP. Revenue rose 6.1% to ¥14,911 million, operating profit 16.4% to ¥223 million, ordinary profit 7.6% to ¥145 million and net profit 3.3% to ¥119 million, for earnings per share of ¥61.94 against ¥59.94. The gap between the operating and ordinary lines is interest: the company runs a heavily geared balance sheet.
The food division lifted revenue 45.1% to ¥9,112 million and segment profit 40.2% to ¥244 million, and now supplies 61% of the company's revenue. Beef prices kept climbing and made margin hard to hold on raw-material sales to restaurants, but new sales proposals landed and volumes grew; imported chicken added new contracts and a wider product range at rising prices. The clear winner was Thai processed foods, where contracted volumes of higher-margin, value-added new items rose sharply — revenue, tonnage and profit all up substantially. Domestic chicken slipped slightly.
Agriculture, China and pork all go backwards
Agricultural products fell 8.6% to ¥1,678 million with profit down 38.6% to ¥18 million: new contract development did not convert into sales. China development fell 9.0% to ¥3,818 million and profit 30.2% to ¥81 million, as exports and third-country trade to China weakened — vehicle sales into China and cosmetics-related sales to Chinese online retailers both declined — while chemicals suffered from price competition, currency swings and Middle East disruption to raw-material sourcing. Chemicals moved into this division from consumer industries in the second quarter, and prior-year figures have been restated for the reclassification.
Consumer industries, now essentially imported pork, fell 82.6% to ¥302 million and turned a ¥3 million segment loss after an ¥11 million profit. Spain suspended pork exports, so the company switched to Brazilian supply, but shipments have not moved at the expected pace on top of excess market inventory, currency moves and higher freight.
A thin balance sheet, slightly thicker
Total assets rose ¥832 million to ¥9,196 million, mainly on inventory. Liabilities rose ¥687 million to ¥8,058 million as short-term borrowings and accrued expenses funded expanding sales of Thai processed goods and imported chicken. Net assets rose ¥144 million to ¥1,137 million on retained profit, lifting the equity ratio to 12.1% from 11.6% — still thin, and the reason interest expense absorbs a third of operating profit. No dividend is paid, and none is forecast.
The full-year target implies a very large fourth quarter
The company left the guidance published on November 14, 2025 unchanged: full-year revenue of ¥25,052 million (+27.4%), operating profit of ¥290 million (+17.2%), ordinary profit of ¥228 million (+31.2%) and net profit of ¥182 million (+22.6%), for earnings per share of ¥94.36. Nine months have delivered ¥14,911 million of that revenue, so the target implies ¥10,141 million in the fourth quarter alone — more than two-thirds of what the first nine months produced, in three months. On profit the arithmetic is easier: nine months already cover 77% of the operating-profit target and 64% of the ordinary-profit target.
| Metric | 9M FY9/2026 | 9M FY9/2025 | Change |
|---|---|---|---|
| Net sales (¥ million) | 14,911 | 14,048 | +6.1% |
| Operating profit (¥ million) | 223 | 191 | +16.4% |
| Ordinary profit (¥ million) | 145 | 135 | +7.6% |
| Net profit (¥ million) | 119 | 115 | +3.3% |
| EPS (¥) | 61.94 | 59.94 | +3.3% |
| Food — revenue (¥ million) | 9,112 | 6,278 | +45.1% |
| Food — segment profit (¥ million) | 244 | 174 | +40.2% |
| Agricultural products — revenue (¥ million) | 1,678 | 1,836 | -8.6% |
| Agricultural products — segment profit (¥ million) | 18 | 29 | -38.6% |
| China development — revenue (¥ million) | 3,818 | 4,196 | -9.0% |
| China development — segment profit (¥ million) | 81 | 116 | -30.2% |
| Consumer industries — revenue (¥ million) | 302 | 1,736 | -82.6% |
| Consumer industries — segment profit (¥ million) | -3 | 11 | profit to loss |
| Total assets (¥ million) | 9,196 | 8,363 | +10.0% |
| Net assets (¥ million) | 1,137 | 993 | +14.5% |
| Equity ratio | 12.1% | 11.6% | +0.5 pt |
| FY9/2026 guidance — revenue (¥ million) | 25,052 | — | +27.4% |
| FY9/2026 guidance — operating profit (¥ million) | 290 | — | +17.2% |
| FY9/2026 guidance — ordinary profit (¥ million) | 228 | — | +31.2% |
| FY9/2026 guidance — net profit (¥ million) | 182 | — | +22.6% |
| FY9/2026 guidance — EPS (¥) | 94.36 | — | — |
| Annual dividend per share (¥) | 0.00 | 0.00 | unchanged |
JapanStockPulse provides informational content only and does not constitute investment advice. Figures are taken from the company's published earnings short report and may be subject to subsequent revision.