Volume growth and cost control
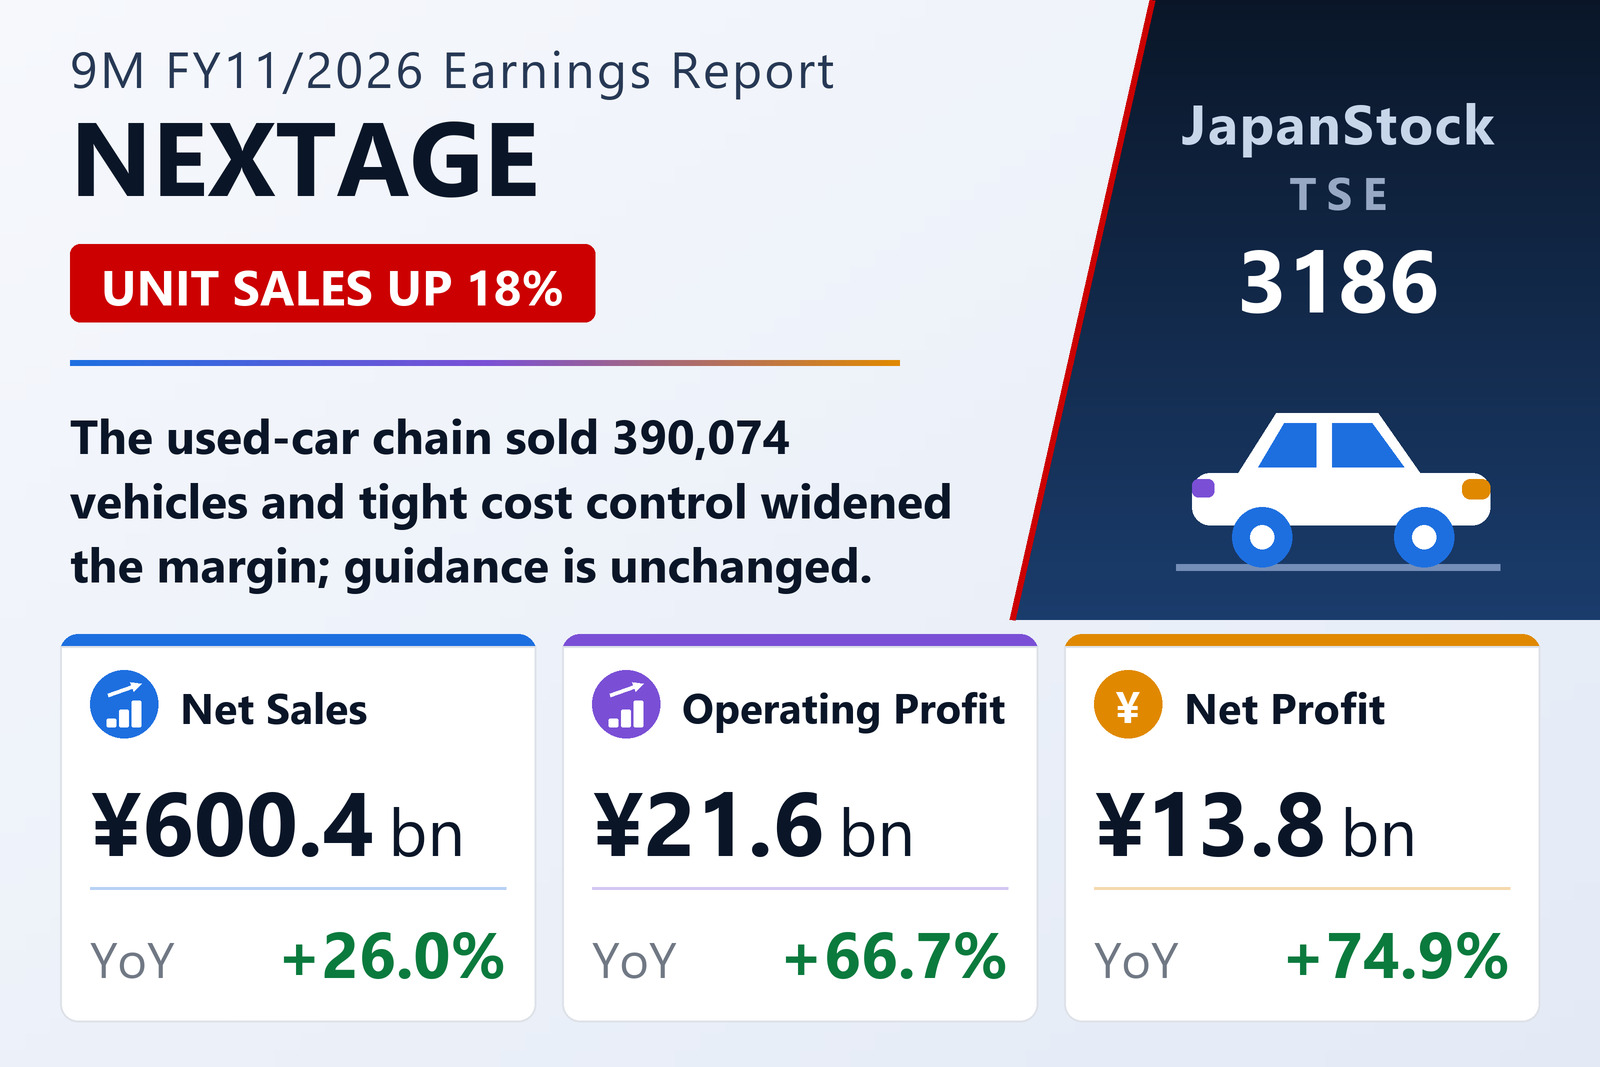
NEXTAGE Co., Ltd. (TSE: 3186), the Nagoya-based operator of large multi-brand used-car superstores and new-car dealerships, reported consolidated results for the first nine months of FY11/2026, from December 1, 2025 to August 31, 2026, on October 5, 2026 under Japanese GAAP. Net sales rose 26.0% to ¥600,422 million and gross profit 17.3% to ¥96,263 million. The gross margin narrowed to 16.0% from 17.2%, but selling, general and administrative expenses grew only 8.1% to ¥74,638 million, so operating profit rose 66.7% to ¥21,624 million and the operating margin widened to 3.6% from 2.7%.
Ordinary profit rose 62.7% to ¥20,187 million, and profit attributable to owners of the parent 74.9% to ¥13,845 million, or ¥176.72 per share against ¥99.44. Taking out the first half, which NEXTAGE reported in July, the third quarter alone produced sales of about ¥209,210 million, operating profit of about ¥7,536 million and net profit of about ¥4,963 million.
Every region sold more
The company sold 390,074 vehicles in the nine months, up 17.7%, while Japan's used-car registrations rose only 0.8%. Sales grew in all six regions: Kanto-Koshinetsu, the largest by volume, rose 31.2% to ¥171,270 million and the home Tokai-Hokuriku region 22.1% to ¥176,178 million. NEXTAGE opened three stand-alone buying stores in the third quarter, in Nerima, Edogawa and Moriguchi-Dainichi, and ended August with 251 sites and 367 stores, of which 199 sites are used-car and 52 new-car.
Inventory-led balance-sheet growth
Total assets rose 15.5% to ¥261,872 million from November 30, as cash rose by ¥14,723 million, inventory by ¥11,776 million and receivables by ¥6,292 million. Current liabilities grew ¥25,870 million, mainly because ¥17,037 million of long-term borrowings and ¥5,000 million of bonds now fall due within a year. Net assets rose 13.5% to ¥89,862 million, and the equity ratio was 34.3% against 34.9%.
Guidance held after July's revision
NEXTAGE kept the FY11/2026 forecast it revised on July 6, 2026: net sales of ¥746,000 million (+14.4%), operating profit of ¥27,600 million (+40.8%), ordinary profit of ¥25,500 million (+37.9%) and net profit of ¥17,100 million (+33.5%), or ¥218.26 per share. Nine-month progress stands at 80% of sales, 78% of operating profit and 81% of net profit, which implies fourth-quarter operating profit of about ¥5,976 million. The company plans a year-end dividend of ¥50.00, up from ¥45.00.
| Metric | 9M FY11/2026 | 9M FY11/2025 | Change |
|---|---|---|---|
| Net sales (¥ million) | 600,422 | 476,660 | +26.0% |
| Gross profit (¥ million) | 96,263 | 82,037 | +17.3% |
| Gross margin | 16.0% | 17.2% | −1.2 pt |
| SG&A expenses (¥ million) | 74,638 | 69,062 | +8.1% |
| Operating profit (¥ million) | 21,624 | 12,975 | +66.7% |
| Operating margin | 3.6% | 2.7% | +0.9 pt |
| Ordinary profit (¥ million) | 20,187 | 12,406 | +62.7% |
| Net profit attrib. to owners of parent (¥ million) | 13,845 | 7,915 | +74.9% |
| EPS (¥) | 176.72 | 99.44 | +77.7% |
| Comprehensive income (¥ million) | 13,894 | 7,934 | +75.1% |
| Vehicles sold (units) | 390,074 | 331,542 | +17.7% |
| Total assets (¥ million) | 261,872 | 226,777 | +15.5% |
| Net assets (¥ million) | 89,862 | 79,195 | +13.5% |
| Equity ratio | 34.3% | 34.9% | −0.6 pt |
| FY11/2026 guidance — revenue (¥ million) | 746,000 | — | +14.4% |
| FY11/2026 guidance — operating profit (¥ million) | 27,600 | — | +40.8% |
| FY11/2026 guidance — ordinary profit (¥ million) | 25,500 | — | +37.9% |
| FY11/2026 guidance — net profit (¥ million) | 17,100 | — | +33.5% |
| FY11/2026 guidance — EPS (¥) | 218.26 | — | n.m. |
| Annual dividend per share (¥) | 50.00 | 45.00 | +11.1% |
JapanStockPulse provides informational content only and does not constitute investment advice. Figures are taken from the company's published earnings short report and may be subject to subsequent revision.