Sales up, margins squeezed
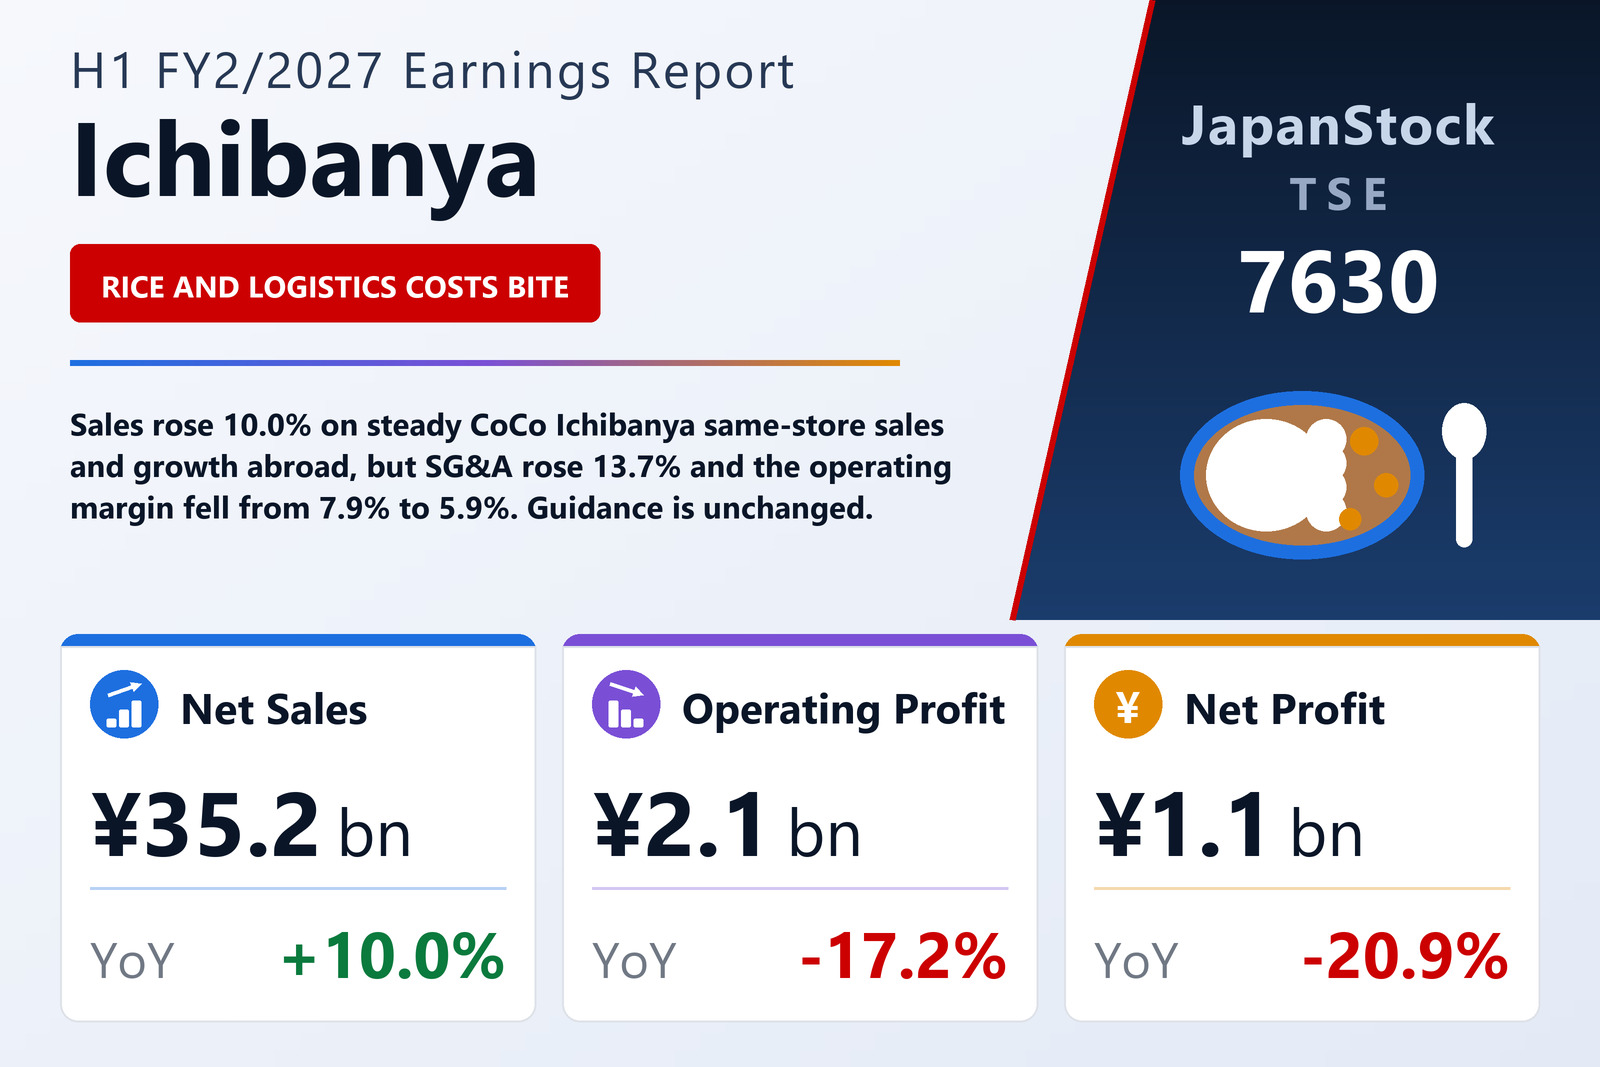
Ichibanya Co., Ltd. (TSE: 7630), the Aichi-based operator of the CoCo Ichibanya curry-rice chain, reported consolidated first-half results for FY2/2027, the six months from March 1 to August 31, 2026, on October 5, 2026 under Japanese GAAP. Net sales rose 10.0% to ¥35,227 million, but gross profit grew only 8.8% to ¥17,364 million as the gross margin slipped 0.6 points to 49.3% on higher prices for rice and other ingredients. Selling, general and administrative expenses, including logistics, rose 13.7% to ¥15,272 million, and operating profit fell 17.2% to ¥2,091 million, a margin of 5.9% against 7.9% a year earlier.
Ordinary profit fell 19.1% to ¥2,191 million. Impairment losses on stores of ¥314 million, against ¥335 million a year earlier, left pre-tax profit down 12.6% to ¥1,872 million, and profit attributable to owners of the parent fell 20.9% to ¥1,095 million, or ¥6.86 per share against ¥8.68.
Collaborations lift spending per visit
System-wide sales at domestic CoCo Ichibanya restaurants, including franchisees, rose 2.9% to ¥47,683 million, and same-store sales grew 2.4%. Customer numbers were flat, but spending per customer rose 2.5%, helped by tie-ups with popular VTubers from hololive production and with the anime film Chiikawa, which brought original menus and limited-edition goods, and by higher-priced limited-time spiced chicken curries. The chain opened two restaurants and closed two, ending August with 1,205 in Japan.
Overseas, system-wide sales rose 14.6% to ¥10,361 million, with same-store sales up 1.1% excluding currency effects on strength in Taiwan and China; the chain opened 11 restaurants and closed nine, for 220 abroad, including a new outlet in March inside Petco Park, home of baseball's San Diego Padres. Domestic subsidiaries, which run Genghis Khan barbecue, tsukemen, motsunabe hot-pot, ramen and parfait formats, grew system-wide sales 62.8% to ¥3,380 million and their store count by eight to 58, helped by the March acquisition of the spice-curry chain Kyu Yamu-tei. Sales of packaged products and e-commerce rose 42.5% to ¥282 million.
Balance sheet and cash flow
Total assets rose 0.6% to ¥48,479 million from February 28, while net assets were flat at ¥32,877 million after dividend payments of ¥1,275 million; the equity ratio eased to 66.5% from 67.0%. Operating cash flow was ¥2,327 million, and cash and cash equivalents fell by ¥821 million to ¥12,227 million.
Guidance kept, second half must improve
Ichibanya kept the FY2/2027 forecast it published on April 6, 2026: net sales of ¥72,600 million (+10.8%), operating profit of ¥5,000 million (+6.0%), ordinary profit of ¥5,040 million (+1.1%) and net profit of ¥2,720 million (+6.1%), or ¥17.04 per share. Reaching it requires second-half operating profit of about ¥2,909 million, against ¥2,091 million in the first half. The annual dividend is unchanged at ¥16.00, paid as ¥8.00 at the half-year and ¥8.00 at year-end.
| Metric | H1 FY2/2027 | H1 FY2/2026 | Change |
|---|---|---|---|
| Net sales (¥ million) | 35,227 | 32,018 | +10.0% |
| Gross profit (¥ million) | 17,364 | 15,963 | +8.8% |
| Gross margin | 49.3% | 49.9% | −0.6 pt |
| SG&A expenses (¥ million) | 15,272 | 13,436 | +13.7% |
| Operating profit (¥ million) | 2,091 | 2,526 | −17.2% |
| Operating margin | 5.9% | 7.9% | −2.0 pt |
| Ordinary profit (¥ million) | 2,191 | 2,708 | −19.1% |
| Pre-tax profit (¥ million) | 1,872 | 2,143 | −12.6% |
| Net profit attrib. to owners of parent (¥ million) | 1,095 | 1,384 | −20.9% |
| EPS (¥) | 6.86 | 8.68 | −21.0% |
| Total assets (¥ million) | 48,479 | 48,171 | +0.6% |
| Net assets (¥ million) | 32,877 | 32,885 | −0.0% |
| Equity ratio | 66.5% | 67.0% | −0.5 pt |
| FY2/2027 guidance — revenue (¥ million) | 72,600 | — | +10.8% |
| FY2/2027 guidance — operating profit (¥ million) | 5,000 | — | +6.0% |
| FY2/2027 guidance — ordinary profit (¥ million) | 5,040 | — | +1.1% |
| FY2/2027 guidance — net profit (¥ million) | 2,720 | — | +6.1% |
| FY2/2027 guidance — EPS (¥) | 17.04 | — | n.m. |
| Annual dividend per share (¥) | 16.00 | 16.00 | unchanged |
JapanStockPulse provides informational content only and does not constitute investment advice. Figures are taken from the company's published earnings short report and may be subject to subsequent revision.