Currency props up the top line
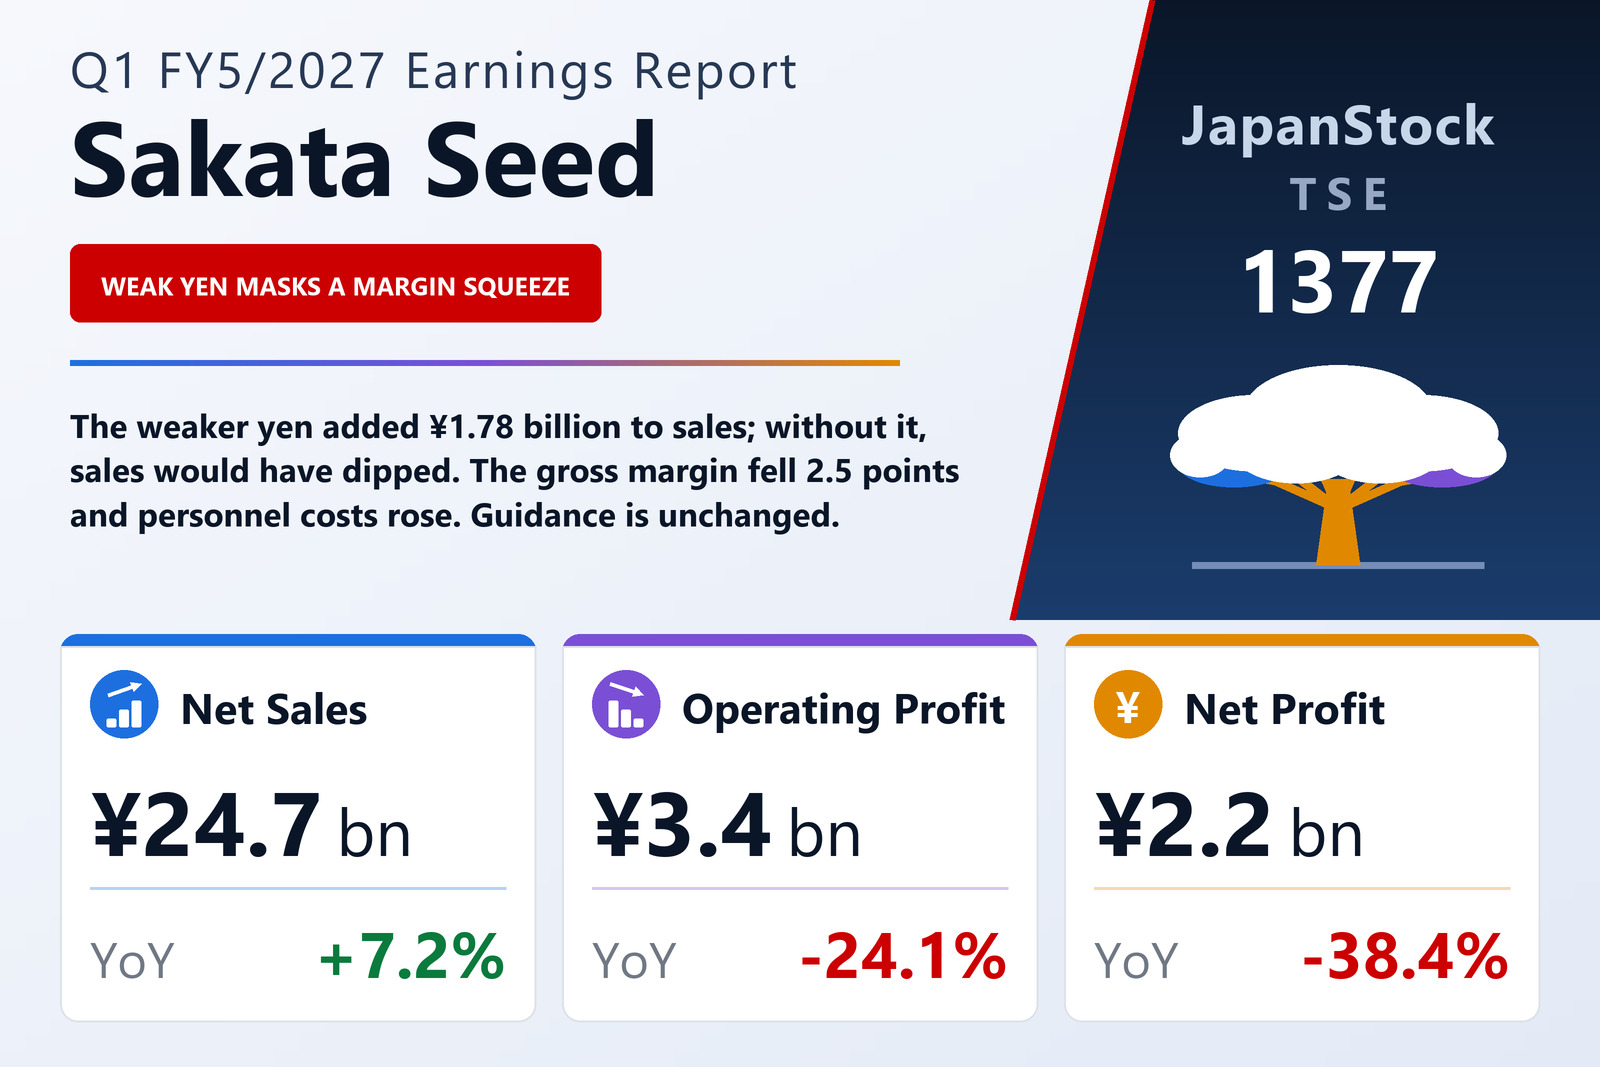
Sakata Seed Corporation (TSE: 1377), the Yokohama-based breeder of vegetable and flower seeds, reported consolidated first-quarter results for FY5/2027, the three months from June 1 to August 31, 2026, on October 6, 2026 under Japanese GAAP. Net sales rose 7.2% to ¥24,670 million, but currency translation contributed ¥1,776 million: overseas subsidiaries were translated at ¥162.45 to the dollar against ¥144.82 a year earlier and at ¥185.44 to the euro against ¥169.64. Without that effect, sales would have been slightly lower than a year ago. Gross profit rose only 3.3% to ¥16,567 million, the gross margin falling 2.5 points to 67.2%, while selling, general and administrative expenses, led by personnel costs, climbed 13.8% to ¥13,180 million.
Operating profit therefore fell 24.1% to ¥3,387 million, a margin of 13.7% against 19.4%. A larger foreign-exchange loss of ¥147 million took ordinary profit down 24.6% to ¥3,671 million, and without the ¥550 million legal settlement booked as extraordinary income a year earlier, profit attributable to owners of the parent fell 38.4% to ¥2,239 million, or ¥53.03 per share against ¥84.09. Comprehensive income, by contrast, rose 29.1% to ¥6,100 million on translation gains.
Overseas wholesale carries the decline
Overseas wholesale, the largest business, grew external sales 7.5% to ¥18,035 million in yen even though sales fell in local currencies: North and Central America slipped as watermelon and tomato declined despite strong pepper and melon, and South America fell on squash, broccoli and sunflower, while Europe, the Middle East and Africa grew on a sharp rise in tomato. Segment profit fell 27.1% to ¥3,813 million on a lower gross margin and higher personnel costs. Domestic wholesale grew external sales 2.2% to ¥4,441 million on new tomato varieties, cabbage, materials and pansies, and lifted segment profit 6.8% to ¥2,453 million.
The retail business, hit by harsh weather and high prices, saw sales slip 1.0% to ¥932 million, but its operating loss narrowed to ¥153 million from ¥210 million. Other businesses, mainly landscaping, grew sales 33.5% to ¥1,260 million and segment profit to ¥64 million from ¥20 million.
Balance sheet and buyback
Total assets rose 2.2% to ¥221,560 million from May 31 and net assets 1.9% to ¥182,384 million, mainly through translation gains; the equity ratio edged down to 82.1% from 82.3%. During the quarter Sakata Seed repurchased 118,900 of its own shares for ¥521 million under a buyback approved on July 13, 2026.
Guidance unchanged
The company kept its FY5/2027 forecasts: net sales of ¥110,000 million (+5.5%), operating profit of ¥13,500 million (+2.9%), ordinary profit of ¥13,500 million (−5.5%) and net profit of ¥10,000 million (−17.8%), or ¥236.63 per share. For the first half it expects net sales of ¥52,500 million and operating profit of ¥6,000 million, down 12.8%. The annual dividend forecast of ¥90.00, paid as ¥40.00 at the half-year and ¥50.00 at year-end, is ¥5 above last year's ¥85.00.
| Metric | Q1 FY5/2027 | Q1 FY5/2026 | Change |
|---|---|---|---|
| Net sales (¥ million) | 24,670 | 23,005 | +7.2% |
| Gross profit (¥ million) | 16,567 | 16,045 | +3.3% |
| Gross margin | 67.2% | 69.7% | −2.5 pt |
| SG&A expenses (¥ million) | 13,180 | 11,583 | +13.8% |
| Operating profit (¥ million) | 3,387 | 4,462 | −24.1% |
| Operating margin | 13.7% | 19.4% | −5.7 pt |
| Ordinary profit (¥ million) | 3,671 | 4,866 | −24.6% |
| Net profit attrib. to owners of parent (¥ million) | 2,239 | 3,637 | −38.4% |
| EPS (¥) | 53.03 | 84.09 | −36.9% |
| Comprehensive income (¥ million) | 6,100 | 4,726 | +29.1% |
| Domestic wholesale — revenue (¥ million) | 4,441 | 4,345 | +2.2% |
| Domestic wholesale — segment profit (¥ million) | 2,453 | 2,298 | +6.8% |
| Overseas wholesale — revenue (¥ million) | 18,035 | 16,774 | +7.5% |
| Overseas wholesale — segment profit (¥ million) | 3,813 | 5,234 | −27.1% |
| Retail — revenue (¥ million) | 932 | 942 | −1.0% |
| Retail — segment profit (¥ million) | −153 | −210 | loss narrowed |
| Other — revenue (¥ million) | 1,260 | 944 | +33.5% |
| Other — segment profit (¥ million) | 64 | 20 | +216.9% |
| Total assets (¥ million) | 221,560 | 216,778 | +2.2% |
| Net assets (¥ million) | 182,384 | 178,983 | +1.9% |
| Equity ratio | 82.1% | 82.3% | −0.2 pt |
| FY5/2027 guidance — revenue (¥ million) | 110,000 | — | +5.5% |
| FY5/2027 guidance — operating profit (¥ million) | 13,500 | — | +2.9% |
| FY5/2027 guidance — ordinary profit (¥ million) | 13,500 | — | −5.5% |
| FY5/2027 guidance — net profit (¥ million) | 10,000 | — | −17.8% |
| FY5/2027 guidance — EPS (¥) | 236.63 | — | n.m. |
| Annual dividend per share (¥) | 90.00 | 85.00 | +5.9% |
JapanStockPulse provides informational content only and does not constitute investment advice. Figures are taken from the company's published earnings short report and may be subject to subsequent revision.