Price revisions and a better mix
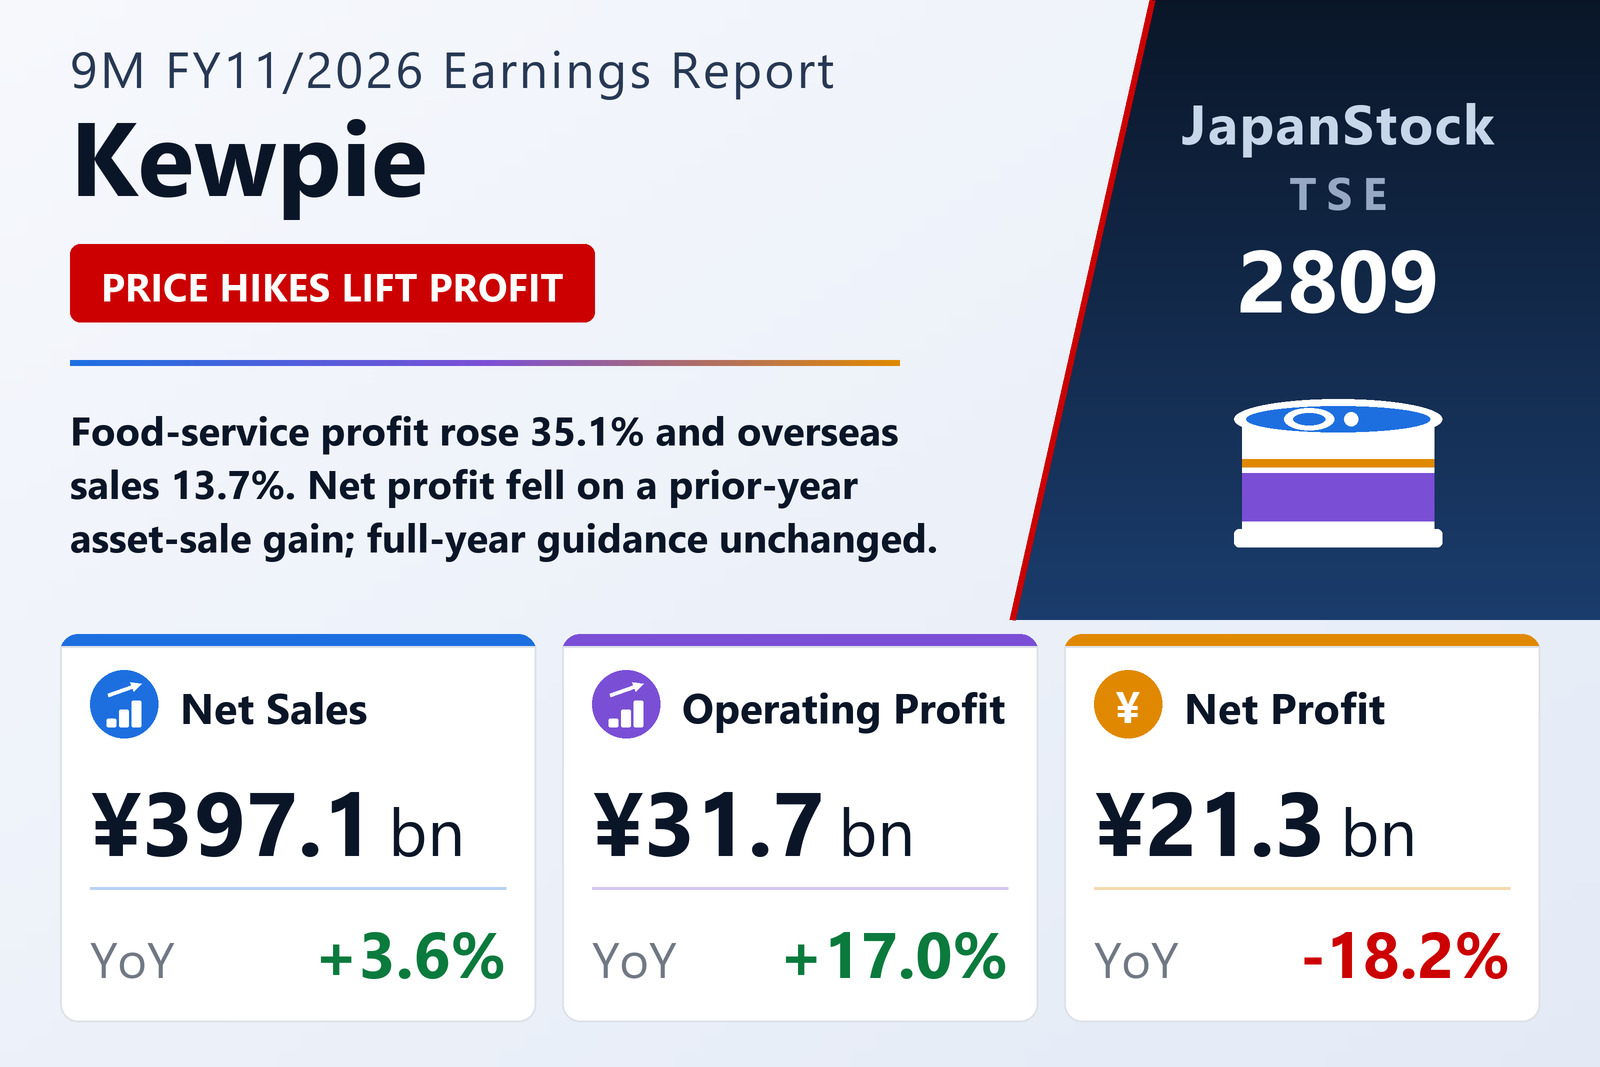
Kewpie Corporation (TSE: 2809), the Tokyo-based maker of mayonnaise, dressings and egg products, reported consolidated results for the first nine months of FY11/2026, the period from December 1, 2025 to August 31, 2026, on October 8, 2026 under Japanese GAAP. Net sales rose 3.6% to ¥397,119 million, operating profit 17.0% to ¥31,658 million and ordinary profit 17.4% to ¥34,315 million. Profit attributable to owners of the parent fell 18.2% to ¥21,311 million, or ¥155.50 per share against ¥187.90.
In Japan, the company said, volumes of processed egg products held up and price revisions to offset higher raw-material costs took hold, while consumers stayed cautious. Egg prices eased as the outbreak of highly pathogenic avian influenza subsided but remained high. Operating profit grew on domestic sales gains, a shift toward higher-value products and more efficient supply-chain management, which outweighed higher depreciation at new overseas plants and lower profit in China.
Food service leads the domestic gains
The retail market segment grew sales 0.4% to ¥144,502 million and profit 20.8% to ¥11,808 million, helped by higher condiment prices, a shift toward higher-value prepared salads and stable raw-material costs for cut vegetables. Food service, which sells to restaurants and bakeries, grew sales 2.9% to ¥140,971 million and profit 35.1% to ¥11,089 million on price revisions for condiments and egg products and higher volumes of processed eggs.
The overseas segment grew sales 13.7% to ¥83,664 million on strong sales in Asia Pacific and a recovery in the Americas, as new plants in both regions came fully on stream, but profit rose only 1.0% to ¥11,180 million after higher depreciation and lower earnings in China. Fruit solutions grew sales 0.8% to ¥13,504 million but profit fell 8.8% to ¥577 million on higher raw-material costs, while fine chemicals lifted profit 73.8% to ¥716 million on mail-order sales of hyaluronic acid and acetic-acid-bacteria supplements.
Balance sheet and buybacks
Total assets rose 0.5% to ¥482,807 million from November 30, with higher inventories and investment securities partly offset by lower cash. Net assets rose to ¥353,793 million and the equity ratio to 67.9% from 67.4%. Treasury stock rose to 6,229,707 shares from 2,326,558 at the end of the previous year, reflecting share repurchases.
Guidance unchanged
Kewpie kept the full-year FY11/2026 forecast it published on January 14, 2026: net sales of ¥530,000 million (+3.2%), operating profit of ¥38,000 million (+9.7%), ordinary profit of ¥40,000 million (+7.0%) and net profit of ¥25,500 million (−16.4%), or ¥184.95 per share. Nine-month operating profit already represents about 83% of the full-year target. The dividend forecast is also unchanged at ¥65.00 (¥32 interim and ¥33 year-end), against ¥64.00 for FY11/2025, which included a ¥10 commemorative dividend for the 100th anniversary of Kewpie Mayonnaise.
| Metric | 9M FY11/2026 | 9M FY11/2025 | Change |
|---|---|---|---|
| Net sales (¥ million) | 397,119 | 383,424 | +3.6% |
| Operating profit (¥ million) | 31,658 | 27,062 | +17.0% |
| Ordinary profit (¥ million) | 34,315 | 29,218 | +17.4% |
| Net profit attrib. to owners of parent (¥ million) | 21,311 | 26,055 | −18.2% |
| EPS (¥) | 155.50 | 187.90 | −17.2% |
| Retail market — revenue (¥ million) | 144,502 | 143,976 | +0.4% |
| Retail market — segment profit (¥ million) | 11,808 | 9,777 | +20.8% |
| Food service — revenue (¥ million) | 140,971 | 136,995 | +2.9% |
| Food service — segment profit (¥ million) | 11,089 | 8,209 | +35.1% |
| Overseas — revenue (¥ million) | 83,664 | 73,567 | +13.7% |
| Overseas — segment profit (¥ million) | 11,180 | 11,070 | +1.0% |
| Fruit solutions — revenue (¥ million) | 13,504 | 13,393 | +0.8% |
| Fruit solutions — segment profit (¥ million) | 577 | 633 | −8.8% |
| Fine chemicals — revenue (¥ million) | 9,748 | 8,973 | +8.6% |
| Fine chemicals — segment profit (¥ million) | 716 | 412 | +73.8% |
| Total assets (¥ million) | 482,807 | 480,531 | +0.5% |
| Net assets (¥ million) | 353,793 | 347,600 | +1.8% |
| Equity ratio | 67.9% | 67.4% | +0.5 pt |
| FY11/2026 guidance — revenue (¥ million) | 530,000 | — | +3.2% |
| FY11/2026 guidance — operating profit (¥ million) | 38,000 | — | +9.7% |
| FY11/2026 guidance — ordinary profit (¥ million) | 40,000 | — | +7.0% |
| FY11/2026 guidance — net profit (¥ million) | 25,500 | — | −16.4% |
| FY11/2026 guidance — EPS (¥) | 184.95 | — | n.m. |
| Annual dividend per share (¥) | 65.00 | 64.00 | +1.6% |
JapanStockPulse provides informational content only and does not constitute investment advice. Figures are taken from the company's published earnings short report and may be subject to subsequent revision.