Sales growth outpaces profit
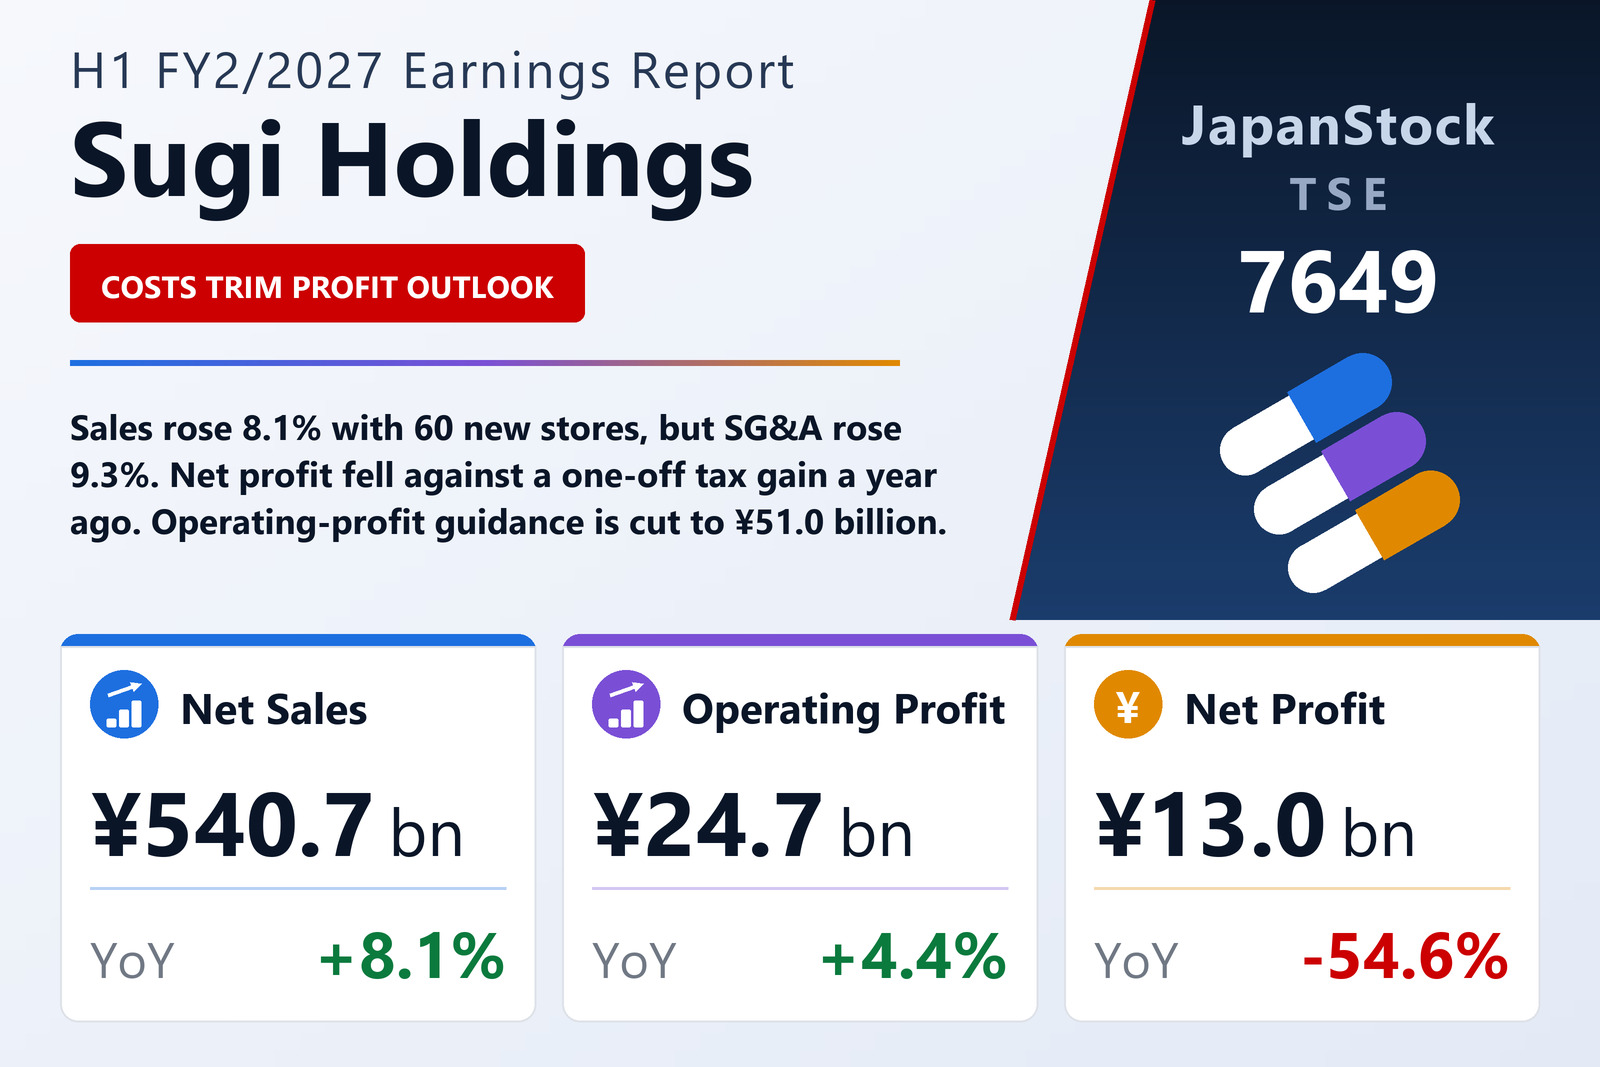
Sugi Holdings Co., Ltd. (TSE: 7649), the Aichi-based operator of the Sugi Pharmacy chain of drugstores and dispensing pharmacies, reported consolidated first-half results for FY2/2027, the six months from March 1 to August 31, 2026, on October 8, 2026 under Japanese GAAP. Net sales rose 8.1% to ¥540,713 million and gross profit 8.5% to ¥169,019 million, but selling, general and administrative expenses rose 9.3% to ¥144,272 million, so operating profit grew only 4.4% to ¥24,747 million. EBITDA rose 3.3% to ¥34,638 million.
Ordinary profit slipped 1.3% to ¥23,911 million. Impairment losses of ¥2,352 million left pre-tax profit at ¥21,017 million, and profit attributable to owners of the parent fell 54.6% to ¥12,989 million, or ¥35.69 per share. The decline reflects the prior-year half, when Sugi booked additional deferred-tax assets on tax-loss carryforwards after absorbing the former I&H Co., Ltd.; per-share figures are restated for a two-for-one stock split that took effect on September 1, 2026.
Stores and dispensing
Sugi continued dominant openings in the Kanto, Chubu and Kansai regions, opening 60 stores, closing 21 and refurbishing 92, to end August with 2,360. It expanded private-brand products and promotions based on customer purchase data. In dispensing, it renovated pharmacy and waiting areas, strengthened ties with medical institutions to take on prescriptions requiring specialist expertise and home-visit dispensing, and adjusted opening hours to win more prescriptions. The company reports a single segment, drugstores and dispensing.
GIC investment strengthens the balance sheet
On July 27, Sugi received payment for a third-party allotment of new shares to GIC Private Limited, raising its capital and capital reserve by ¥8,118 million each. Net assets rose 8.9% to ¥316,227 million from February 28 and the equity ratio rose to 50.2% from 47.3%, on total assets of ¥630,310 million. Operating cash flow fell 74.1% to ¥17,195 million, which the company attributed to the timing of supplier payments around a bank holiday at the previous year-end, a temporary effect; it also issued ¥22,500 million of bonds.
Sales forecast up, profit forecasts down
Sugi revised the FY2/2027 forecast it published on April 9, 2026. It now expects net sales of ¥1,117,900 million (+10.6%), up from ¥1,092,000 million, but cut EBITDA to ¥72,500 million from ¥77,400 million, operating profit to ¥51,000 million (+5.0%) from ¥54,000 million, ordinary profit to ¥51,400 million from ¥55,000 million and net profit to ¥27,400 million (−39.1%) from ¥32,800 million, or ¥73.62 per share on a post-split basis. It paid an interim dividend of ¥15 and plans a year-end dividend of ¥10 per post-split share, equal to ¥20 before the split, for an unchanged annual ¥35 on a pre-split basis.
| Metric | H1 FY2/2027 | H1 FY2/2026 | Change |
|---|---|---|---|
| Net sales (¥ million) | 540,713 | 500,172 | +8.1% |
| Gross profit (¥ million) | 169,019 | 155,748 | +8.5% |
| SG&A expenses (¥ million) | 144,272 | 132,052 | +9.3% |
| EBITDA (¥ million) | 34,638 | 33,528 | +3.3% |
| Operating profit (¥ million) | 24,747 | 23,696 | +4.4% |
| Ordinary profit (¥ million) | 23,911 | 24,236 | −1.3% |
| Net profit attrib. to owners of parent (¥ million) | 12,989 | 28,616 | −54.6% |
| EPS (¥) | 35.69 | 79.06 | −54.9% |
| Total assets (¥ million) | 630,310 | 614,493 | +2.6% |
| Net assets (¥ million) | 316,227 | 290,474 | +8.9% |
| Equity ratio | 50.2% | 47.3% | +2.9 pt |
| FY2/2027 guidance — revenue (¥ million) | 1,117,900 | — | +10.6% |
| FY2/2027 guidance — EBITDA (¥ million) | 72,500 | — | +5.6% |
| FY2/2027 guidance — operating profit (¥ million) | 51,000 | — | +5.0% |
| FY2/2027 guidance — ordinary profit (¥ million) | 51,400 | — | +2.7% |
| FY2/2027 guidance — net profit (¥ million) | 27,400 | — | −39.1% |
| FY2/2027 guidance — EPS (¥) | 73.62 | — | n.m. |
JapanStockPulse provides informational content only and does not constitute investment advice. Figures are taken from the company's published earnings short report and may be subject to subsequent revision.