Traffic and spending both rise
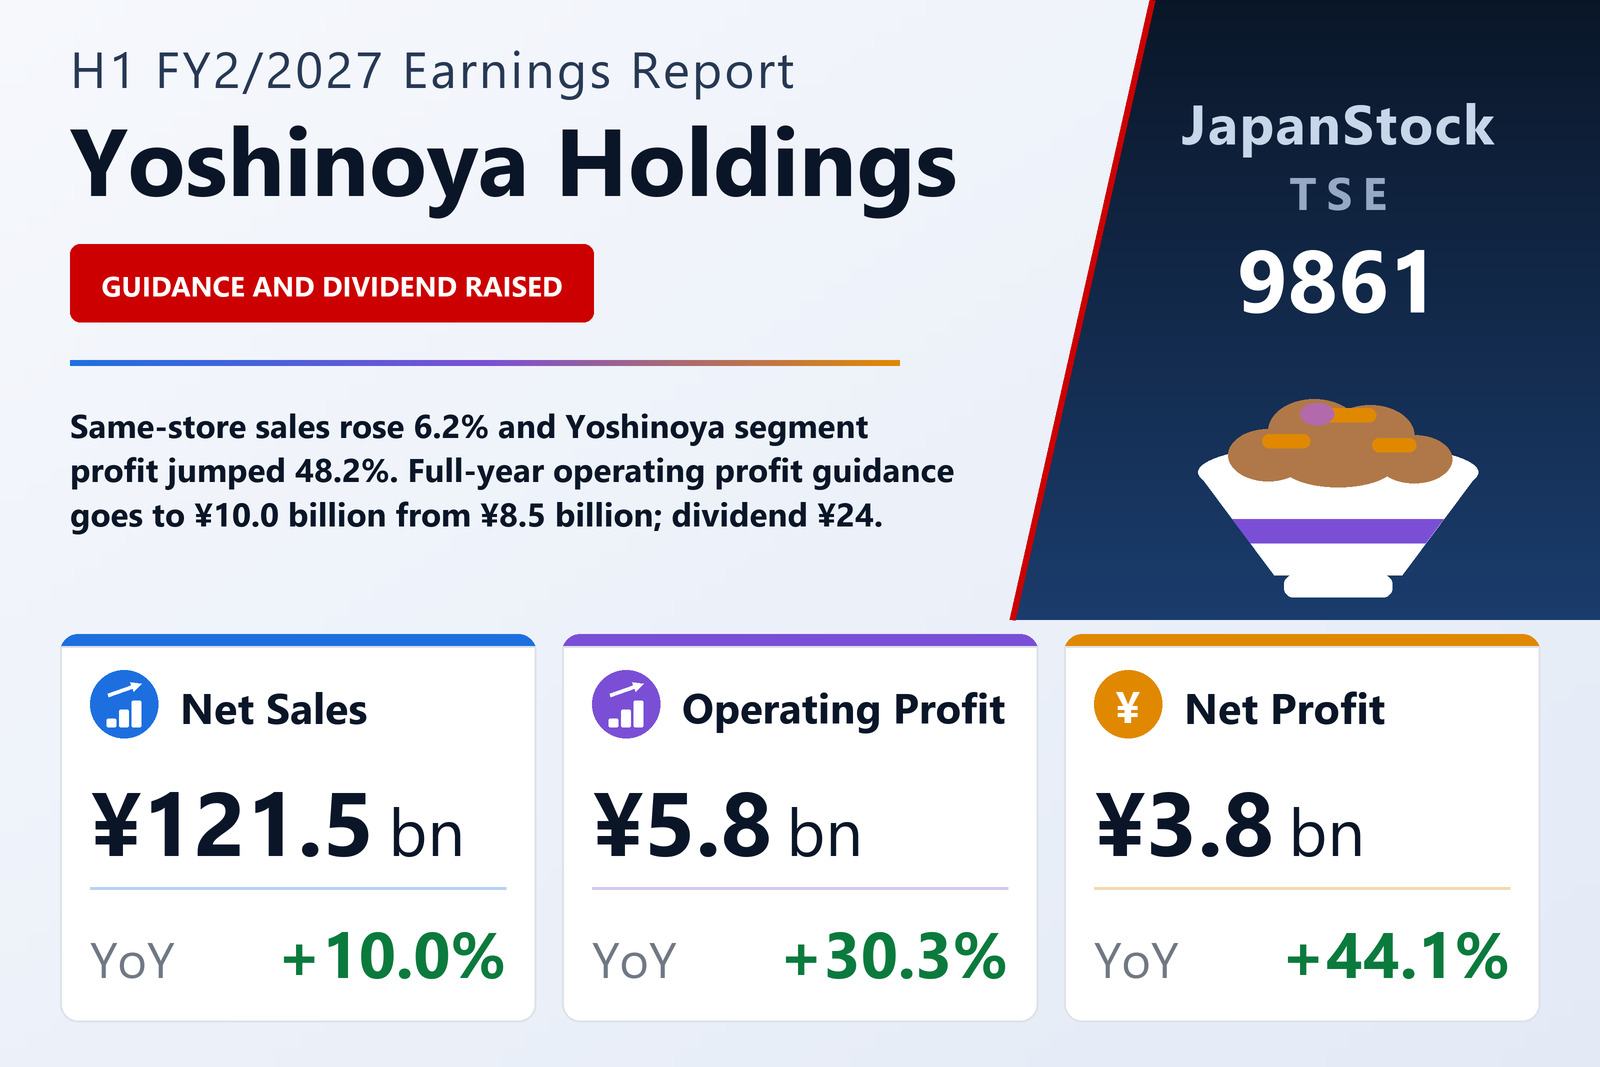
Yoshinoya Holdings Co., Ltd. (TSE: 9861), the Tokyo-based restaurant group behind the Yoshinoya beef-bowl (gyudon) chain and Hanamaru Udon, reported consolidated first-half results for FY2/2027, the six months from March 1 to August 31, 2026, on October 8, 2026 under Japanese GAAP. Net sales rose 10.0% to ¥121,494 million and operating profit 30.3% to ¥5,782 million. Ordinary profit rose 29.6% to ¥6,222 million, and profit attributable to owners of the parent rose 44.1% to ¥3,810 million, or ¥58.96 per share against ¥40.87.
Same-store sales across the group rose 6.2%. The company opened 44 restaurants in Japan and 78 abroad, ending August with 2,924. During the half it merged six domestic Yoshinoya operating companies into one to centralize decision-making, set up a group-wide ramen division in August and expanded the domestic plants of noodle maker Takara Sangyo from two sites to five.
Yoshinoya leads the gains
The Yoshinoya segment grew sales 9.9% to ¥81,248 million and segment profit 48.2% to ¥5,492 million, as menus built around gyudon and beef, such as a gyudon and abura-soba noodle set and a sizzling beef teppan set meal, together with TV advertising, topping campaigns and IP tie-ups, lifted both customer numbers and spending per customer. It ended the period with 1,287 restaurants, 618 of them in its new service format, and has installed in-store ordering tablets in 1,192 outlets. Hanamaru, the udon chain, grew sales 7.3% to ¥18,026 million and profit 1.8% to ¥1,706 million with 426 restaurants. The overseas segment, which consolidates January–June results, grew sales 15.9% to ¥16,049 million and profit 22.1% to ¥1,063 million, helped by a loyalty program in the United States.
U.S. ramen acquisition
On September 1, after the period ended, the group acquired 70.0% of Kizuki International LLC, which runs 17 ramen restaurants centered on Seattle, through its U.S. subsidiary, for ¥3,744 million paid in cash and treasury shares. Total assets rose 6.9% to ¥133,403 million from February 28, and the equity ratio fell to 51.8% from 54.5% as short-term borrowings increased.
Guidance and dividend raised
Yoshinoya raised its FY2/2027 forecast to net sales of ¥248,000 million (+9.9%), operating profit of ¥10,000 million (+23.6%), ordinary profit of ¥10,400 million (+18.1%) and net profit of ¥6,000 million (+28.6%), or ¥92.85 per share, up from the ¥242,000 million, ¥8,500 million, ¥8,800 million and ¥4,900 million it had guided before. It paid an interim dividend of ¥12 and expects a ¥12 year-end payment, for an annual ¥24.00 against ¥22.00 last year.
| Metric | H1 FY2/2027 | H1 FY2/2026 | Change |
|---|---|---|---|
| Net sales (¥ million) | 121,494 | 110,446 | +10.0% |
| Operating profit (¥ million) | 5,782 | 4,438 | +30.3% |
| Ordinary profit (¥ million) | 6,222 | 4,802 | +29.6% |
| Net profit attrib. to owners of parent (¥ million) | 3,810 | 2,644 | +44.1% |
| EPS (¥) | 58.96 | 40.87 | +44.3% |
| Yoshinoya — revenue (¥ million) | 81,248 | 73,911 | +9.9% |
| Yoshinoya — segment profit (¥ million) | 5,492 | 3,706 | +48.2% |
| Hanamaru — revenue (¥ million) | 18,026 | 16,803 | +7.3% |
| Hanamaru — segment profit (¥ million) | 1,706 | 1,675 | +1.8% |
| Overseas — revenue (¥ million) | 16,049 | 13,845 | +15.9% |
| Overseas — segment profit (¥ million) | 1,063 | 870 | +22.1% |
| Total assets (¥ million) | 133,403 | 124,824 | +6.9% |
| Net assets (¥ million) | 69,904 | 68,712 | +1.7% |
| Equity ratio | 51.8% | 54.5% | −2.7 pt |
| FY2/2027 guidance — revenue (¥ million) | 248,000 | — | +9.9% |
| FY2/2027 guidance — operating profit (¥ million) | 10,000 | — | +23.6% |
| FY2/2027 guidance — ordinary profit (¥ million) | 10,400 | — | +18.1% |
| FY2/2027 guidance — net profit (¥ million) | 6,000 | — | +28.6% |
| FY2/2027 guidance — EPS (¥) | 92.85 | — | n.m. |
| Annual dividend per share (¥) | 24.00 | 22.00 | +9.1% |
JapanStockPulse provides informational content only and does not constitute investment advice. Figures are taken from the company's published earnings short report and may be subject to subsequent revision.