Sales and margin fall short of plan
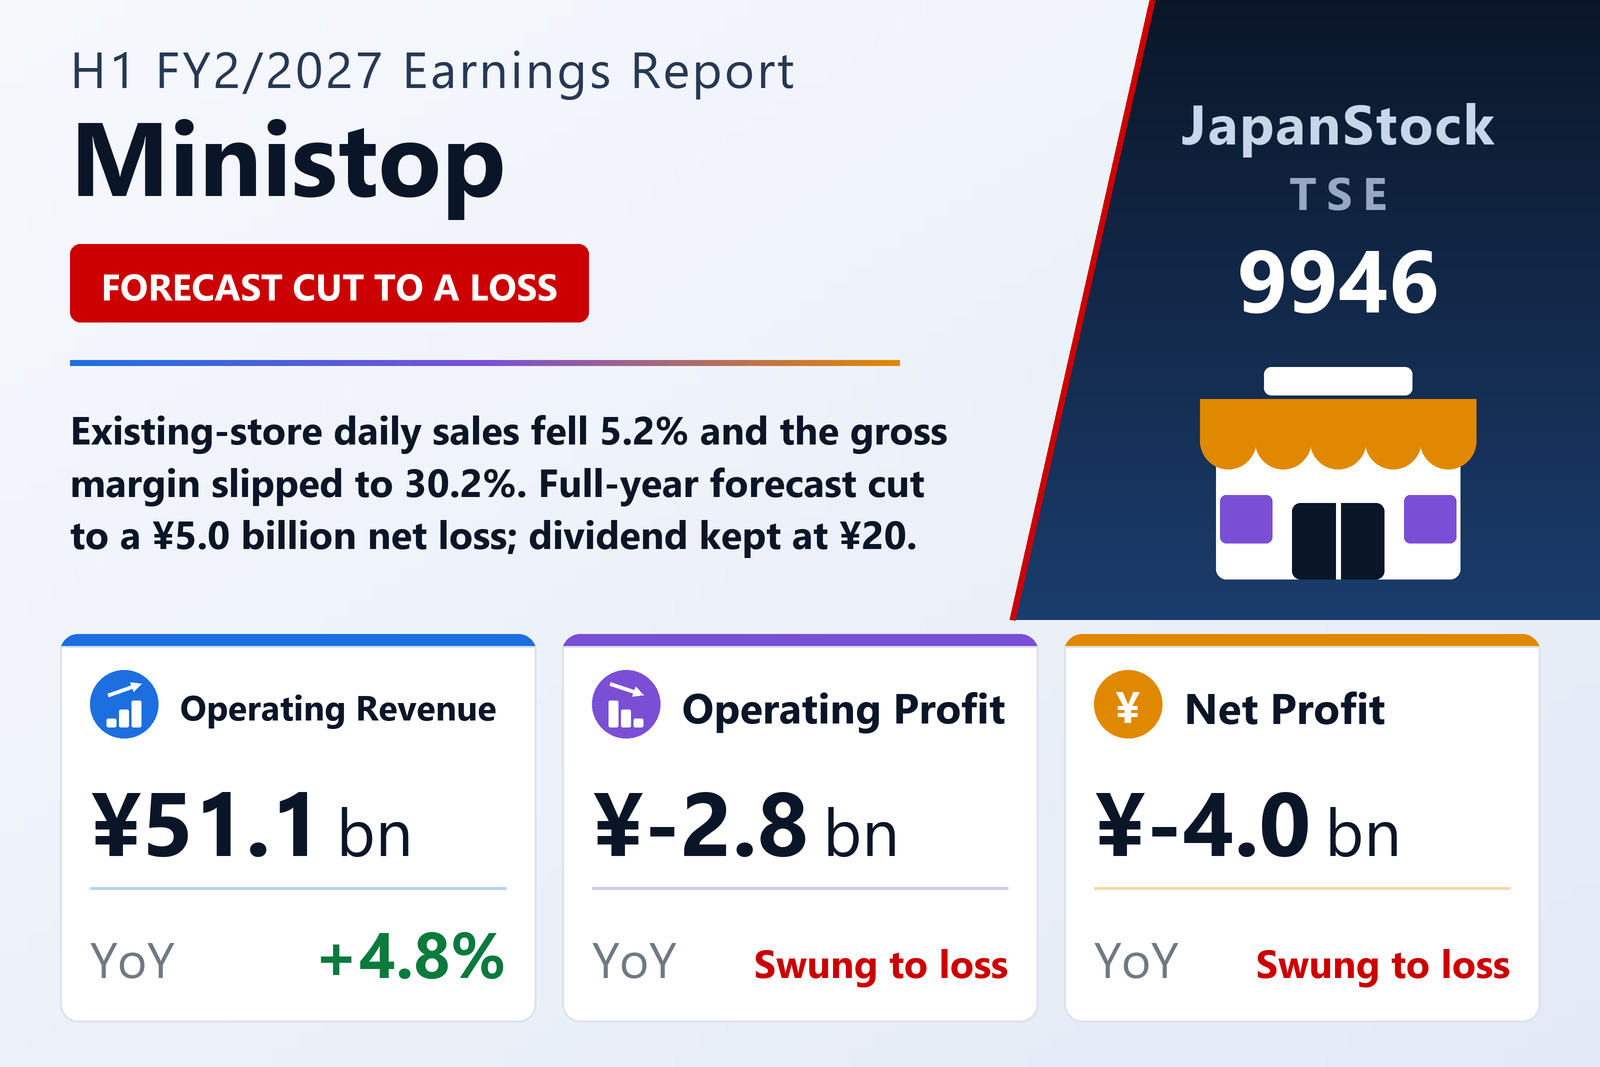
Ministop Co., Ltd. (TSE: 9946), the Chiba-based convenience-store chain and an AEON group company, reported consolidated first-half results for FY2/2027, the six months from March 1 to August 31, 2026, on October 8, 2026 under Japanese GAAP. Operating revenue rose 4.8% to ¥51,073 million, but the group posted an operating loss of ¥2,836 million against an operating profit of ¥1,116 million and an ordinary loss of ¥2,611 million against a ¥1,348 million profit. The net loss attributable to owners of the parent was ¥3,995 million, or ¥137.73 per share, against a profit of ¥502 million, or ¥17.32. Impairment losses rose to ¥933 million from ¥422 million.
The company said shoppers stayed cautious amid persistent inflation and that it was slow to add higher-priced meal items, which also dragged on related purchases such as drinks. In-store fast food suffered from late launches of hot snacks and weak sales of cold desserts in a rainy June. Daily sales at existing Ministop stores fell to 94.8% of the prior year, with customer numbers at 93.7% and average spending at 101.2%; existing-store sales of in-store fast food were just 80.9% of a year earlier. The gross margin fell 1.2 points to 30.2%.
Domestic loss, Vietnam turns the corner
The domestic segment grew operating revenue 4.1% to ¥45,899 million but swung to an operating loss of ¥2,810 million from a ¥1,375 million profit. Total chain sales fell to 92.3% of the prior year as Ministop closed 75 unprofitable stores, against a full-year plan of 80, and opened four, ending August with 1,722 stores in Japan. Growth businesses held up: its unstaffed MINISTOP POCKET workplace outlets reached 2,290 sites and beat their profit plan, and delivery sales rose more than 50%. The overseas segment, now centred on Vietnam, grew revenue 11.3% to ¥5,173 million and narrowed its operating loss to ¥25 million from ¥259 million, turning profitable in the second quarter.
Balance sheet
Total assets fell 13.6% to ¥59,655 million from February 28, mainly as deposits with an affiliated company fell by ¥7,000 million, and net assets fell to ¥22,890 million, leaving the equity ratio at 37.2% against 38.3%. Operating cash flow was an outflow of ¥6,401 million, against an inflow of ¥14,234 million a year earlier, chiefly because trade payables fell by ¥5,253 million.
Forecast cut, dividend kept
Ministop cut the FY2/2027 forecast it had issued on April 8, 2026. It still expects operating revenue of ¥97,000 million (+5.7%), but now forecasts an operating loss of ¥2,800 million, an ordinary loss of ¥2,300 million and a net loss of ¥5,000 million, or a loss of ¥172.37 per share, against earlier forecasts of profits of ¥1,500 million, ¥1,900 million and ¥100 million. It said categories it had relied on to make up for lost sales of in-store handmade rice balls fell short of plan; to recover, it will expand handmade rice balls at stores certified to resume making them, strengthen daily foods such as rice and deli items, and launch new hot snacks and cold desserts. The annual dividend forecast is unchanged at ¥20.00 (¥10 interim and ¥10 year-end), the same as for FY2/2026.
| Metric | H1 FY2/2027 | H1 FY2/2026 | Change |
|---|---|---|---|
| Operating revenue (¥ million) | 51,073 | 48,727 | +4.8% |
| Operating profit (¥ million) | -2,836 | 1,116 | profit to loss |
| Ordinary profit (¥ million) | -2,611 | 1,348 | profit to loss |
| Net profit attrib. to owners of parent (¥ million) | -3,995 | 502 | profit to loss |
| EPS (¥) | -137.73 | 17.32 | profit to loss |
| Domestic — revenue (¥ million) | 45,899 | 44,076 | +4.1% |
| Domestic — segment profit (¥ million) | -2,810 | 1,375 | profit to loss |
| Overseas — revenue (¥ million) | 5,173 | 4,650 | +11.3% |
| Overseas — segment profit (¥ million) | -25 | -259 | loss narrowed |
| Total assets (¥ million) | 59,655 | 69,013 | −13.6% |
| Net assets (¥ million) | 22,890 | 27,163 | −15.7% |
| Equity ratio | 37.2% | 38.3% | −1.1 pt |
| FY2/2027 guidance — operating revenue (¥ million) | 97,000 | — | +5.7% |
| FY2/2027 guidance — operating profit (¥ million) | -2,800 | — | n.m. |
| FY2/2027 guidance — ordinary profit (¥ million) | -2,300 | — | n.m. |
| FY2/2027 guidance — net profit (¥ million) | -5,000 | — | n.m. |
| FY2/2027 guidance — EPS (¥) | -172.37 | — | n.m. |
| Annual dividend per share (¥) | 20.00 | 20.00 | unchanged |
JapanStockPulse provides informational content only and does not constitute investment advice. Figures are taken from the company's published earnings short report and may be subject to subsequent revision.