Steel-frame demand stays weak
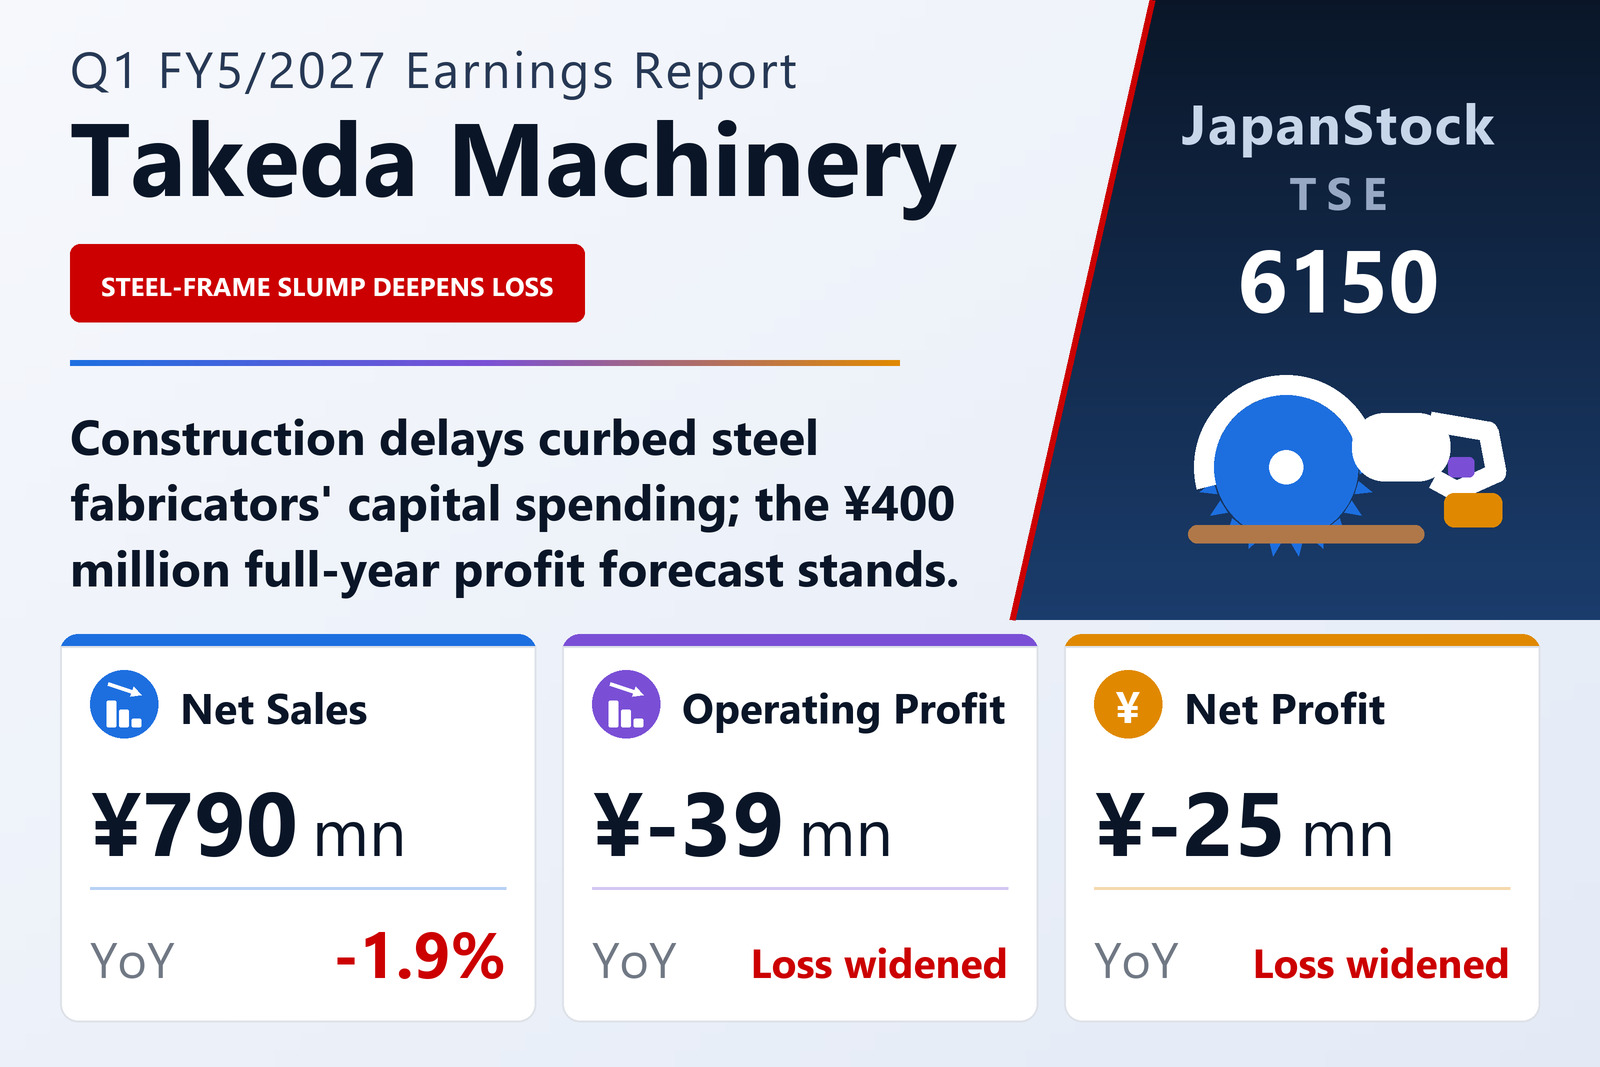
Takeda Machinery Co., Ltd. (TSE: 6150) reported consolidated results for the first quarter of FY5/2027, June 1 to August 31, 2026, on October 15, 2026 under Japanese GAAP. Net sales fell 1.9% to ¥790 million, the operating loss widened to ¥39 million from ¥13 million and the ordinary loss to ¥34 million from ¥9 million. The net loss attributable to owners of the parent widened to ¥25 million from ¥8 million, or ¥28.12 per share. The company said demand from urban steel structures, national-resilience infrastructure work, logistics warehouses and data centres persists, but labour shortages and higher building costs are stretching, delaying or cancelling projects; with overall structural-steel volumes low, fabricators are holding back capital spending, while rising costs and long lead times for some parts add to the strain. It called conditions extremely severe.
Product lines
The company operates a single metal-processing machinery segment. By product, sales of steel-section processing machines fell 4.3% to ¥440 million and dies 21.1% to ¥75 million, while circular-saw cutting machines nearly doubled, up 99.9% to ¥37 million, and service grew 36.7% to ¥38 million. Parts slipped 3.1% to ¥132 million and contract work and other sales were flat at ¥66 million. The company is developing labour-saving products and updating its core IT system, due to go live in June 2027.
Balance sheet and outlook
Total assets fell 7.1% to ¥7,212 million from May 31, mainly because trade receivables dropped by ¥734 million and cash by ¥213 million, while net assets fell 1.5% to ¥5,379 million and the equity ratio rose to 74.6% from 70.3%. The company left its FY5/2027 forecast unchanged: net sales of ¥5,200 million (+2.4%), operating profit of ¥400 million (−7.5%), ordinary profit of ¥400 million (−10.0%) and net profit of ¥260 million (−12.8%). For the first half it expects sales of ¥2,590 million and operating profit of ¥230 million. It plans a year-end dividend of ¥80, unchanged.
| Metric | Q1 FY5/2027 | Q1 FY5/2026 | Change |
|---|---|---|---|
| Net sales (¥ million) | 790 | 806 | −1.9% |
| Operating profit (¥ million) | −39 | −13 | loss widened |
| Ordinary profit (¥ million) | −34 | −9 | loss widened |
| Net profit attrib. to owners of parent (¥ million) | −25 | −8 | loss widened |
| EPS (¥) | −28.12 | −9.21 | loss widened |
| Total assets (¥ million) | 7,212 | 7,767 | −7.1% |
| Net assets (¥ million) | 5,379 | 5,463 | −1.5% |
| Equity ratio | 74.6% | 70.3% | +4.3 pt |
| FY5/2027 guidance — revenue (¥ million) | 5,200 | — | +2.4% |
| FY5/2027 guidance — operating profit (¥ million) | 400 | — | −7.5% |
| FY5/2027 guidance — ordinary profit (¥ million) | 400 | — | −10.0% |
| FY5/2027 guidance — net profit (¥ million) | 260 | — | −12.8% |
| Annual dividend per share (¥) | 80.00 | 80.00 | unchanged |
JapanStockPulse provides informational content only and does not constitute investment advice. Figures are taken from the company's published earnings short report and may be subject to subsequent revision.