Shipments run ahead of plan
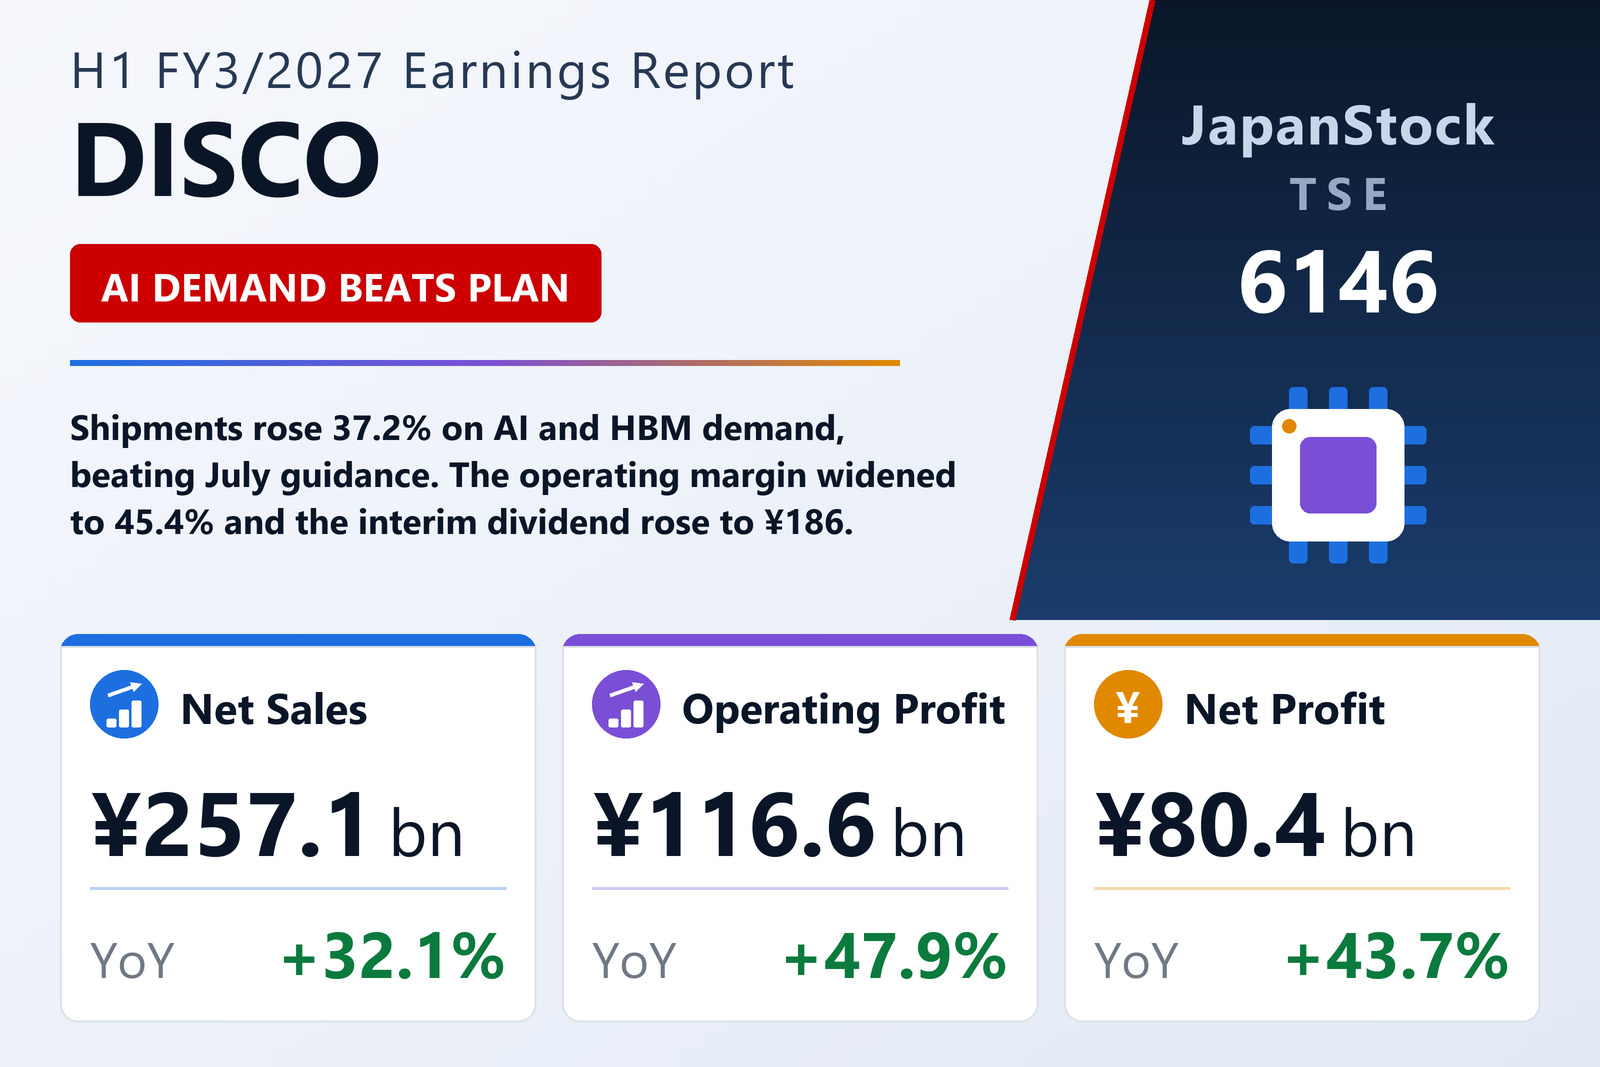
DISCO Corporation (TSE: 6146), the maker of dicing saws, grinders and laser saws used to cut and thin semiconductor wafers, reported consolidated results for the first half of FY3/2027, from April 1 to September 30, 2026, on October 22, 2026 under Japanese GAAP. Net sales rose 32.1% to ¥257,058 million, operating profit 47.9% to ¥116,639 million and ordinary profit 44.0% to ¥114,437 million. Net profit attributable to owners of the parent increased 43.7% to ¥80,366 million, or ¥740.84 per share against ¥515.70.
Continued data-center investment on the back of generative AI kept demand for high-performance chips such as advanced logic and HBM (high-bandwidth memory) at high levels. Shipments of precision processing equipment were strong, led by high-value-added machines for those chips, and shipments of consumable precision tools stayed high in line with customers' utilization rates. Total shipments rose 37.2% to ¥284,584 million. Results beat the first-half guidance DISCO issued in July, which called for net sales of ¥242,800 million and operating profit of ¥104,900 million.
Margins widen
Gross profit rose 37.2% to ¥183,917 million as favorable exchange rates and a richer mix of high-value-added products lifted the gross margin, more than absorbing a 22.0% rise in selling, general and administrative expenses to ¥67,277 million on higher personnel and R&D costs. The operating margin widened to 45.4% from 40.5%. The company booked a ¥636 million impairment on a building at its German subsidiary DISCO HI-TEC EUROPE in Bavaria, which is to be demolished to make way for a new one.
Balance sheet and cash flow
Total assets rose by ¥81,173 million from March 31 to ¥824,584 million, mainly on higher cash and deposits, while contract liabilities grew on the liabilities side. Net assets increased to ¥629,013 million and the equity ratio was 76.1%, down 2.8 points. Operating activities generated ¥111,708 million, investing activities used ¥54,814 million and financing activities, mostly dividend payments, used ¥40,617 million, leaving cash and equivalents of ¥200,627 million.
Nine-month guidance and dividend
DISCO discloses forecasts only for the period immediately ahead. For April to December it now expects net sales of ¥389,500 million (+28.2%), operating profit of ¥174,700 million (+38.4%), ordinary profit of ¥173,400 million (+37.1%) and net profit of ¥121,900 million (+31.6%), or ¥1,123.43 per share, with nine-month shipments of ¥434.2 billion at an assumed ¥151 to the U.S. dollar for October to December. It raised the interim dividend to ¥186.00 from the ¥171.00 it had forecast in July, against ¥129.00 a year earlier; the year-end dividend has not been decided.
| Metric | H1 FY3/2027 | H1 FY3/2026 | Change |
|---|---|---|---|
| Shipments (¥ million) | 284,584 | — | +37.2% |
| Net sales (¥ million) | 257,058 | 194,537 | +32.1% |
| Gross profit (¥ million) | 183,917 | 134,009 | +37.2% |
| SG&A expenses (¥ million) | 67,277 | 55,138 | +22.0% |
| Operating profit (¥ million) | 116,639 | 78,871 | +47.9% |
| Operating margin | 45.4% | 40.5% | +4.9 pt |
| Ordinary profit (¥ million) | 114,437 | 79,465 | +44.0% |
| Net profit attrib. to owners of parent (¥ million) | 80,366 | 55,913 | +43.7% |
| EPS (¥) | 740.84 | 515.70 | +43.7% |
| Comprehensive income (¥ million) | 81,271 | 56,115 | +44.8% |
| Total assets (¥ million) | 824,584 | 743,410 | +10.9% |
| Net assets (¥ million) | 629,013 | 588,125 | +7.0% |
| Equity ratio | 76.1% | 78.9% | −2.8 pt |
| 9M FY3/2027 guidance — revenue (¥ million) | 389,500 | — | +28.2% |
| 9M FY3/2027 guidance — operating profit (¥ million) | 174,700 | — | +38.4% |
| 9M FY3/2027 guidance — ordinary profit (¥ million) | 173,400 | — | +37.1% |
| 9M FY3/2027 guidance — net profit (¥ million) | 121,900 | — | +31.6% |
| Interim dividend per share (¥) | 186.00 | 129.00 | +44.2% |
JapanStockPulse provides informational content only and does not constitute investment advice. Figures are taken from the company's published earnings short report and may be subject to subsequent revision.