Electronics materials carry the half
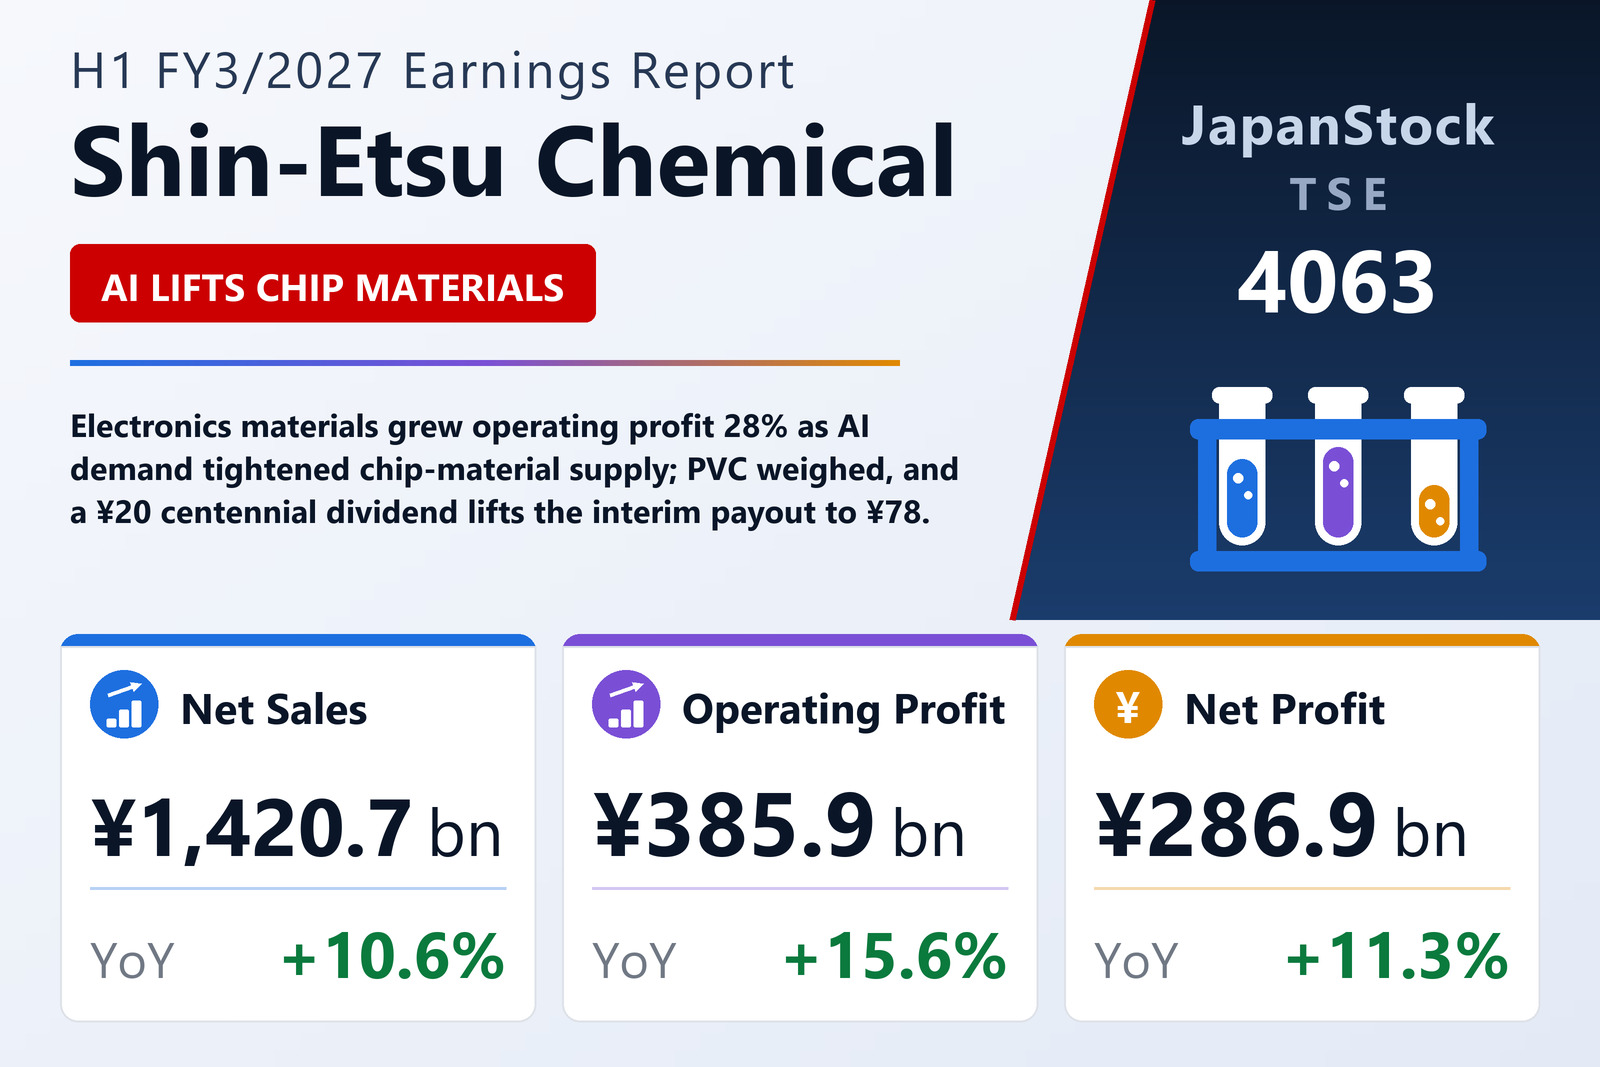
Shin-Etsu Chemical Co., Ltd. (TSE: 4063) reported consolidated results for the first half of FY3/2027, April 1 to September 30, 2026, on October 27, 2026 under Japanese GAAP. The company said the semiconductor market grew sharply on what it called historic AI-related investment centred on data centers, leaving several product groups in tight supply; careful allocation and price revisions lifted its semiconductor-materials sales. Electronics materials grew sales 16% to about ¥577.7 billion and operating profit 28% to about ¥218.9 billion. Profit gathered pace through the half: July–September operating profit was 27% above a year earlier and ordinary profit 20% higher. Earnings per share rose 14.0% to ¥155.71, helped by fewer shares after the buyback.
PVC softens, functional materials climb
Infrastructure materials, which include PVC and caustic soda, grew sales 4% to about ¥522.1 billion but operating profit fell 16% to about ¥86.2 billion. PVC prices in Asia softened in late May on excess inventory and slower demand, though the company pushed through a price increase in July and the market then held broadly steady; caustic soda was firm. Functional materials grew sales 11% to about ¥245.6 billion and operating profit 31% to about ¥63.2 billion on higher sales of high-value silicone and other products. Processing, trading and technical services grew sales 12% to about ¥75.1 billion and profit 28% to about ¥17.4 billion on steady demand for semiconductor-wafer containers.
Buyback completed, forecast and dividend
Total assets rose 5.2% to ¥5,955,899 million, and the equity ratio slipped to 75.6% from 78.7% after the company completed the ¥250 billion buyback authorized in April, acquiring about 10.07 million shares for ¥52,713 million in July and about 34.67 million for ¥197,285 million in August. It kept its July forecast for FY3/2027 of net sales of ¥2,700,000 million (+4.9%), operating profit of ¥700,000 million (+10.2%), ordinary profit of ¥770,000 million (+8.7%) and net profit of ¥525,000 million (+10.7%). The interim dividend of ¥78 comprises a ¥58 ordinary payout and a ¥20 centennial dividend, and with a ¥58 year-end payout planned the annual total is ¥136, against ¥106 for FY3/2026.
| Metric | H1 FY3/2027 | H1 FY3/2026 | Change |
|---|---|---|---|
| Net sales (¥ million) | 1,420,684 | 1,284,522 | +10.6% |
| Operating profit (¥ million) | 385,918 | 333,935 | +15.6% |
| Ordinary profit (¥ million) | 415,108 | 367,339 | +13.0% |
| Net profit attrib. to owners of parent (¥ million) | 286,939 | 257,844 | +11.3% |
| EPS (¥) | 155.71 | 136.61 | +14.0% |
| Total assets (¥ million) | 5,955,899 | 5,661,907 | +5.2% |
| Net assets (¥ million) | 4,688,362 | 4,643,307 | +1.0% |
| Equity ratio | 75.6% | 78.7% | −3.1 pt |
| FY3/2027 guidance — revenue (¥ million) | 2,700,000 | — | +4.9% |
| FY3/2027 guidance — operating profit (¥ million) | 700,000 | — | +10.2% |
| FY3/2027 guidance — ordinary profit (¥ million) | 770,000 | — | +8.7% |
| FY3/2027 guidance — net profit (¥ million) | 525,000 | — | +10.7% |
| Annual dividend per share (¥) | 136.00 | 106.00 | +28.3% |
JapanStockPulse provides informational content only and does not constitute investment advice. Figures are taken from the company's published earnings short report and may be subject to subsequent revision.