Every service line grows, margins widen
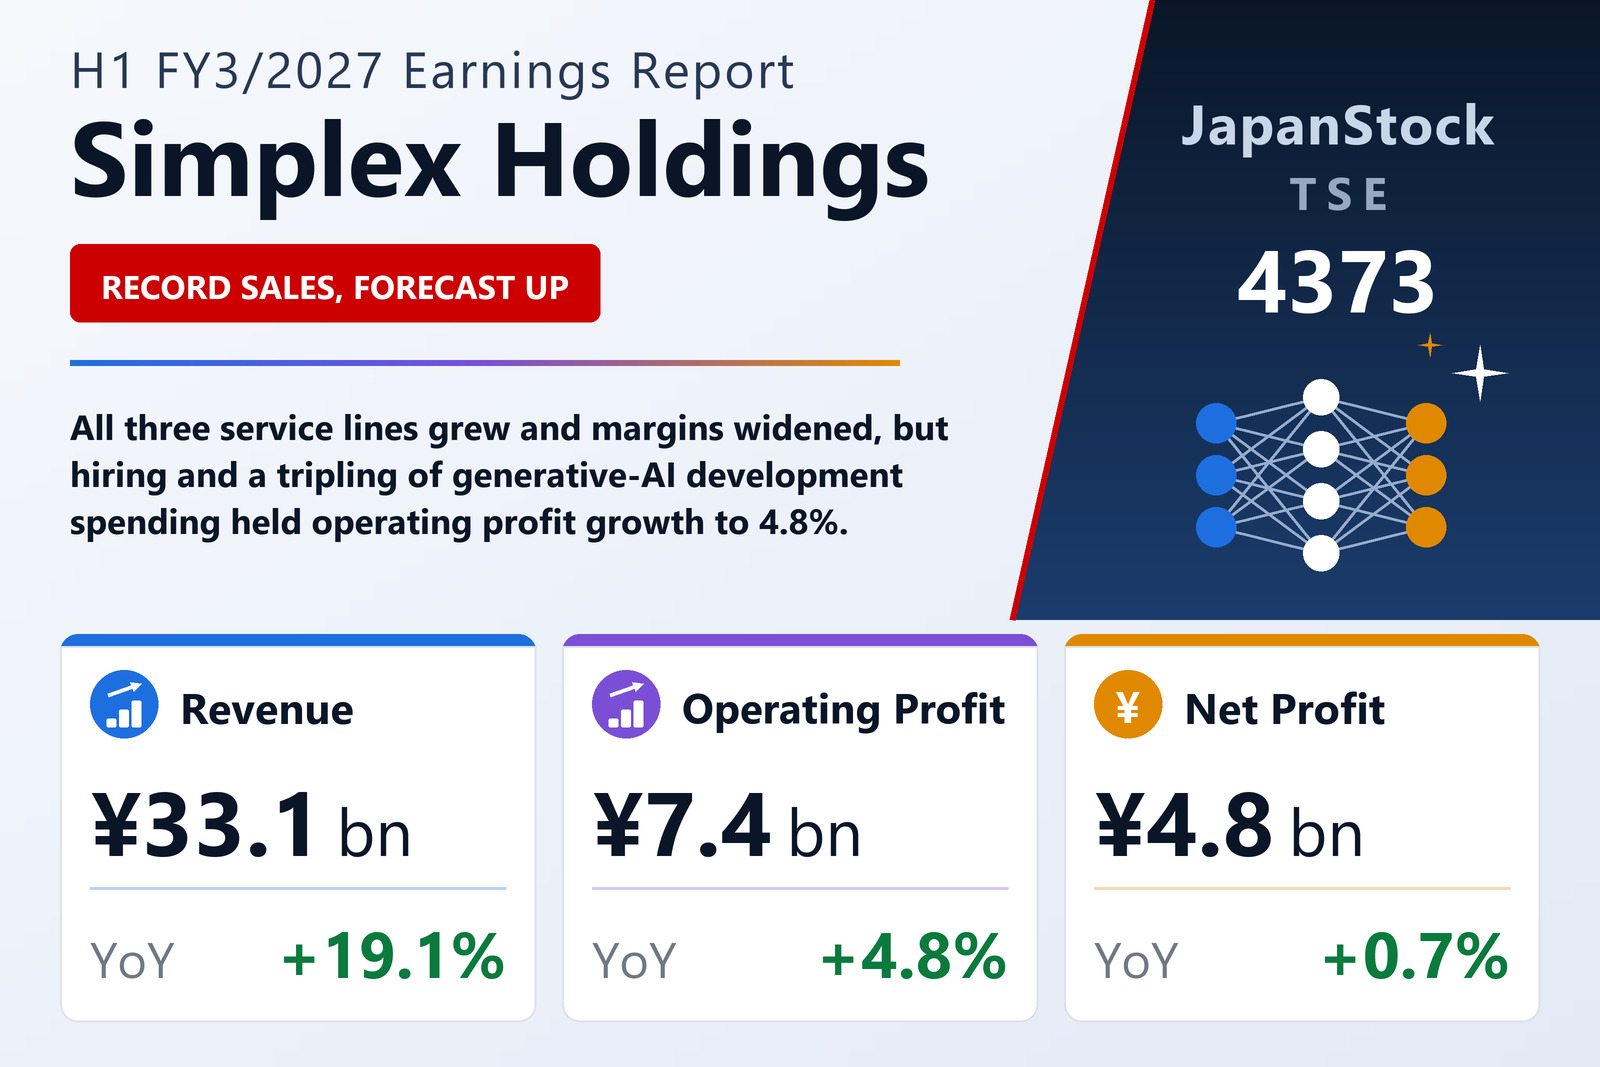
Simplex Holdings, Inc. (TSE: 4373) reported consolidated IFRS results for the first half of FY3/2027, April 1 to September 30, 2026, on October 28, 2026. Revenue was a record for both the quarter and the half. System integration, the largest line, grew 21.0% to ¥19,522 million at a 47.0% gross margin against 44.5%; strategy and DX consulting grew 26.6% to ¥6,126 million at 49.6% against 46.8%; and operation services grew 9.0% to ¥7,432 million at 42.5% against 40.1%. The group gross margin widened to 46.5% from 43.9%.
Hiring and AI tooling absorb the gain
Selling, general and administrative expenses rose 32.8% to ¥6,088 million on stepped-up graduate and mid-career recruitment, and research and development spending rose 238.3% to ¥1,880 million from ¥556 million as the company rebuilds its development process around generative AI, standardising know-how and upgrading its development platform. The operating margin therefore narrowed to 22.3% from 25.4%. Pre-tax profit rose 3.2% to ¥7,280 million and basic earnings per share were ¥21.48 against ¥21.01.
Forecast raised, dividend plan intact
Total assets fell 3.1% to ¥85,468 million as receivables were collected and lease liabilities paid down, and the owners' equity ratio rose to 61.4% from 58.4%. Operating cash flow was ¥5,511 million against ¥5,005 million. Simplex raised its FY3/2027 forecast to revenue of ¥71,000 million (+21.0%) from ¥70,000 million and operating profit of ¥17,500 million (+21.4%) from ¥17,200 million, with pre-tax profit of ¥17,229 million; the net profit forecast of ¥12,420 million (+17.9%) is unchanged. The planned annual dividend remains ¥24, paid at year end, against ¥18.
| Metric | H1 FY3/2027 | H1 FY3/2026 | Change |
|---|---|---|---|
| Revenue (¥ million) | 33,122 | 27,801 | +19.1% |
| Gross profit (¥ million) | 15,414 | 12,192 | +26.4% |
| Gross margin | 46.5% | 43.9% | +2.6 pt |
| SG&A expenses (¥ million) | 6,088 | 4,585 | +32.8% |
| Operating profit (¥ million) | 7,397 | 7,055 | +4.8% |
| Operating margin | 22.3% | 25.4% | -3.1 pt |
| Pre-tax profit (¥ million) | 7,280 | 7,052 | +3.2% |
| Net profit attrib. to owners of parent (¥ million) | 4,810 | 4,777 | +0.7% |
| EPS (¥) | 21.48 | 21.01 | +2.2% |
| Strategy/DX Consulting — revenue (¥ million) | 6,126 | 4,838 | +26.6% |
| System Integration — revenue (¥ million) | 19,522 | 16,135 | +21.0% |
| Operation Services — revenue (¥ million) | 7,432 | 6,820 | +9.0% |
| Total assets (¥ million) | 85,468 | 88,169 | -3.1% |
| Equity attrib. to owners of parent (¥ million) | 52,452 | 51,450 | +1.9% |
| Equity ratio | 61.4% | 58.4% | +3.0 pt |
| FY3/2027 guidance — revenue (¥ million) | 71,000 | — | +21.0% |
| FY3/2027 guidance — operating profit (¥ million) | 17,500 | — | +21.4% |
| FY3/2027 guidance — pre-tax profit (¥ million) | 17,229 | — | +20.0% |
| FY3/2027 guidance — net profit (¥ million) | 12,420 | — | +17.9% |
| Annual dividend per share (¥) | 24.00 | 18.00 | +33.3% |
JapanStockPulse provides informational content only and does not constitute investment advice. Figures are taken from the company's published earnings short report and may be subject to subsequent revision.