Paint lines up, car parts down
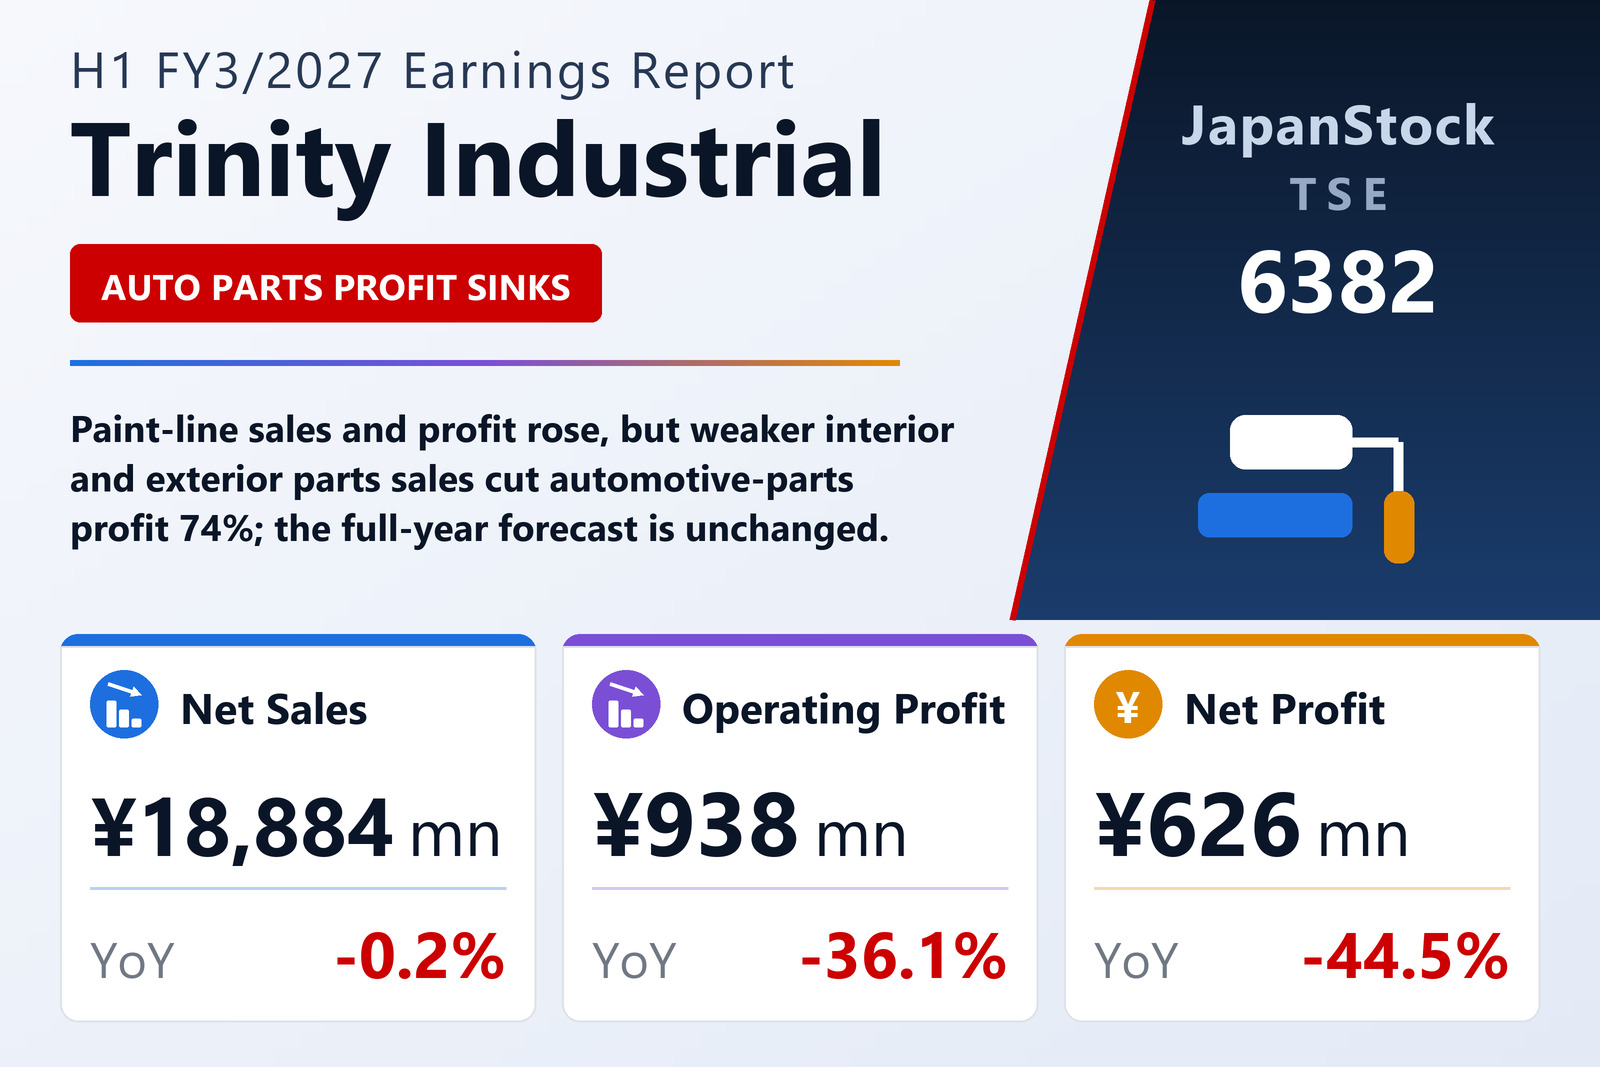
Trinity Industrial Corporation (TSE: 6382) reported consolidated results for the first half of FY3/2027, April 1 to September 30, 2026, on October 28, 2026 under Japanese GAAP. The equipment segment, which builds painting systems for car plants, grew sales 4.7% to ¥14,643 million on higher deliveries of paint equipment, and its operating profit rose 4.5% to ¥1,891 million. The automotive-parts segment saw sales of interior and exterior parts fall, cutting its sales 14.1% to ¥4,240 million and its operating profit 74.0% to ¥183 million from ¥704 million. Comprehensive income fell 34.8% to ¥755 million and earnings per share were ¥38.79 against ¥69.98.
Balance sheet, forecast and dividend
Total assets rose 0.7% to ¥44,427 million as cash and deposits grew ¥1,996 million while receivables and contract assets fell ¥2,123 million; net assets slipped 0.5% to ¥35,053 million and the equity ratio was 78.1% against 78.5%. Trinity kept its FY3/2027 forecast of net sales of ¥40,000 million (+2.7%), operating profit of ¥2,000 million (−37.3%), ordinary profit of ¥2,850 million (−23.6%) and net profit of ¥1,950 million (−27.5%). It raised the interim dividend to ¥30 from ¥26 and plans ¥31 at year end, for an annual ¥61 against ¥67.
| Metric | H1 FY3/2027 | H1 FY3/2026 | Change |
|---|---|---|---|
| Net sales (¥ million) | 18,884 | 18,928 | -0.2% |
| Operating profit (¥ million) | 938 | 1,467 | -36.1% |
| Ordinary profit (¥ million) | 1,275 | 1,816 | -29.8% |
| Net profit attrib. to owners of parent (¥ million) | 626 | 1,128 | -44.5% |
| Comprehensive income (¥ million) | 755 | 1,157 | -34.8% |
| EPS (¥) | 38.79 | 69.98 | -44.6% |
| Equipment — revenue (¥ million) | 14,643 | 13,990 | +4.7% |
| Equipment — segment profit (¥ million) | 1,891 | 1,811 | +4.5% |
| Automotive Parts — revenue (¥ million) | 4,240 | 4,937 | -14.1% |
| Automotive Parts — segment profit (¥ million) | 183 | 704 | -74.0% |
| Total assets (¥ million) | 44,427 | 44,119 | +0.7% |
| Net assets (¥ million) | 35,053 | 35,236 | -0.5% |
| Equity ratio | 78.1% | 78.5% | -0.4 pt |
| FY3/2027 guidance — revenue (¥ million) | 40,000 | — | +2.7% |
| FY3/2027 guidance — operating profit (¥ million) | 2,000 | — | -37.3% |
| FY3/2027 guidance — ordinary profit (¥ million) | 2,850 | — | -23.6% |
| FY3/2027 guidance — net profit (¥ million) | 1,950 | — | -27.5% |
| Annual dividend per share (¥) | 61.00 | 67.00 | -9.0% |
JapanStockPulse provides informational content only and does not constitute investment advice. Figures are taken from the company's published earnings short report and may be subject to subsequent revision.