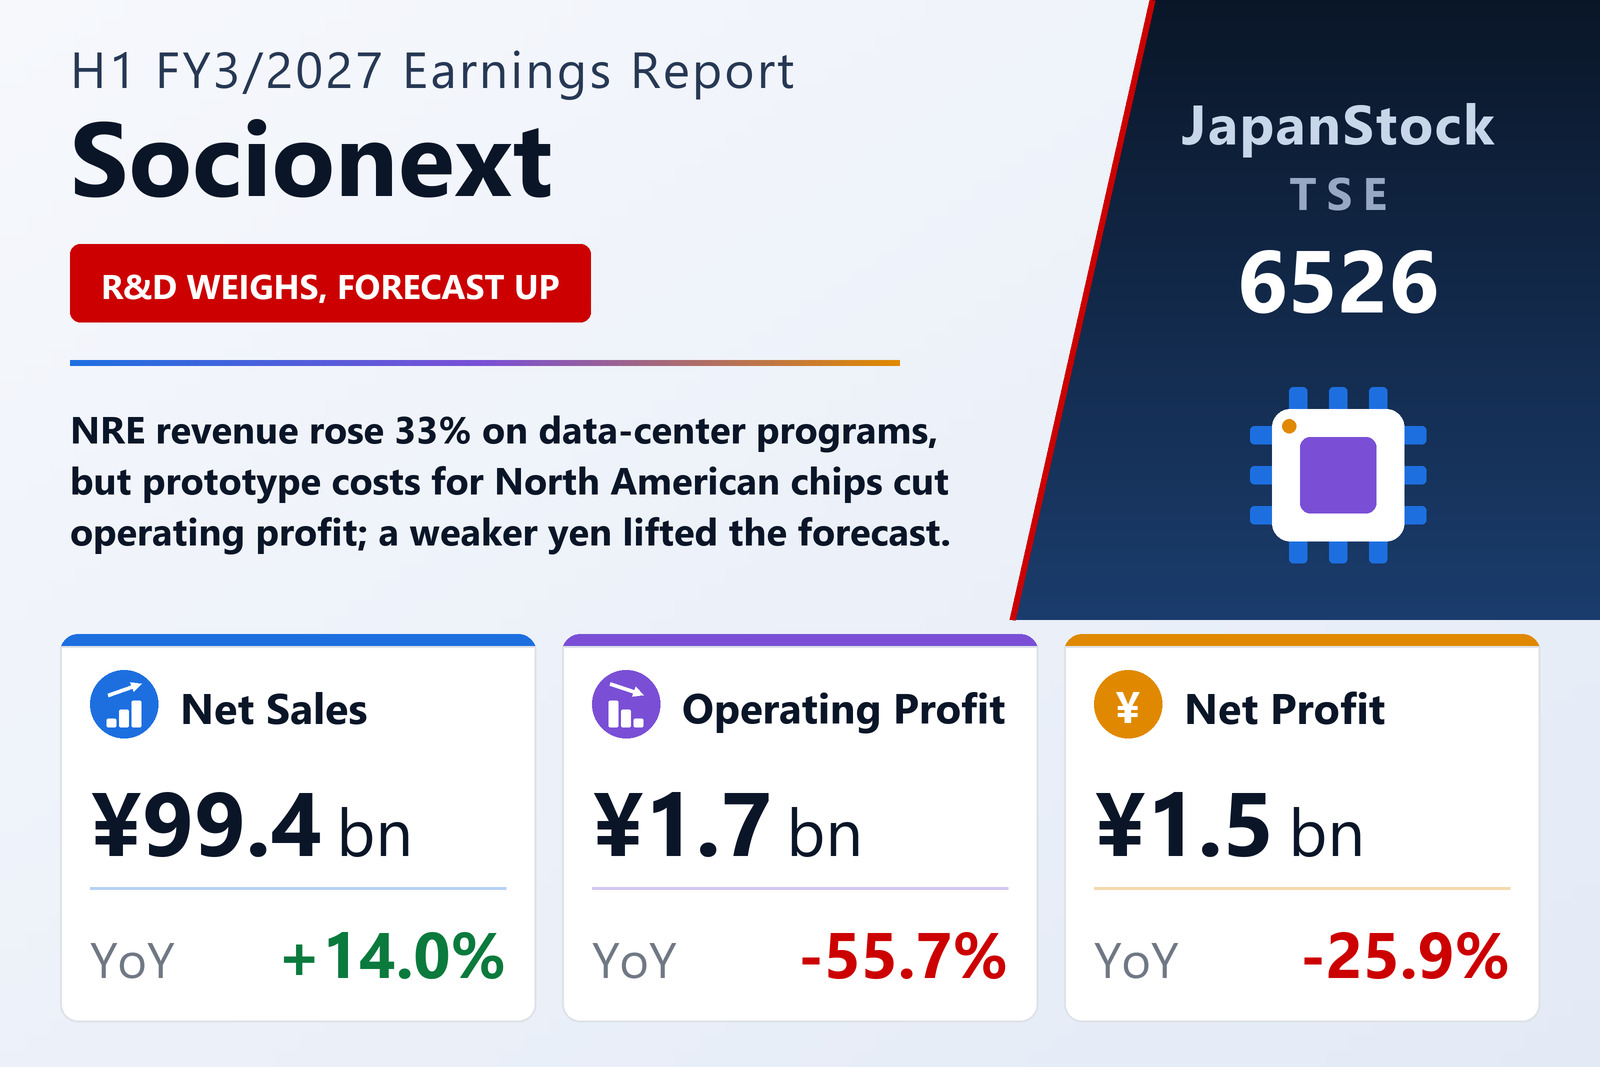
NRE revenue jumps a third
Socionext Inc. (TSE: 6526) reported consolidated results for the first half of FY3/2027, April 1 to September 30, 2026, on October 28, 2026 under Japanese GAAP. Product sales, received once a chip reaches volume production, rose 10.2% to ¥77,551 million on automotive and industrial demand. NRE revenue, the design fees received in stages during development, rose 32.9% to ¥21,827 million, led by data-center and network programs. The dollar averaged ¥159.4, ¥13.4 weaker than a year earlier.
Margins squeezed by mix and development
Cost of sales rose 19.8% to ¥54,232 million and the product gross margin fell 5.6 points to 30.1% on a change in product mix, though gross profit still rose 7.8% to ¥45,191 million. Research and development spending rose 16.8% to ¥33,825 million as the company kept up prototype work for new North American data-center and automotive chips due to ramp from the second half, plus advance development, so selling, general and administrative expenses rose 14.0% to ¥43,523 million. Foreign-exchange gains lifted ordinary profit above operating profit.
Inventory builds ahead of shipments; forecast raised
Total assets rose 6.9% to ¥179,116 million as inventories built for North American products due to ship from the second half and fixed assets grew ¥10,403 million on reticles, test boards and IP. Cash and equivalents fell ¥21,784 million to ¥22,757 million and the equity ratio dropped to 72.8% from 79.4% after short-term borrowing under a commitment line. Because the yen was weaker than planned, Socionext raised its FY3/2027 forecast to net sales of ¥225,000 million (+12.0%) from ¥215,000 million, operating and ordinary profit of ¥15,500 million each from ¥14,000 million, and net profit of ¥10,500 million (+20.2%) from ¥10,000 million, assuming ¥130 to the dollar from the third quarter. The annual dividend stays at ¥50.
| Metric | H1 FY3/2027 | H1 FY3/2026 | Change |
|---|---|---|---|
| Net sales (¥ million) | 99,423 | 87,209 | +14.0% |
| Product sales (¥ million) | 77,551 | 70,357 | +10.2% |
| NRE revenue (¥ million) | 21,827 | 16,428 | +32.9% |
| Operating profit (¥ million) | 1,668 | 3,767 | -55.7% |
| Ordinary profit (¥ million) | 2,240 | 2,792 | -19.8% |
| Net profit attrib. to owners of parent (¥ million) | 1,526 | 2,058 | -25.9% |
| Comprehensive income (¥ million) | 1,406 | 2,190 | -35.8% |
| EPS (¥) | 8.70 | 11.70 | -25.6% |
| Total assets (¥ million) | 179,116 | 167,623 | +6.9% |
| Net assets (¥ million) | 130,345 | 133,056 | -2.0% |
| Equity ratio | 72.8% | 79.4% | -6.6 pt |
| FY3/2027 guidance — revenue (¥ million) | 225,000 | — | +12.0% |
| FY3/2027 guidance — operating profit (¥ million) | 15,500 | — | +25.5% |
| FY3/2027 guidance — ordinary profit (¥ million) | 15,500 | — | +31.8% |
| FY3/2027 guidance — net profit (¥ million) | 10,500 | — | +20.2% |
| Annual dividend per share (¥) | 50.00 | 50.00 | unchanged |
JapanStockPulse provides informational content only and does not constitute investment advice. Figures are taken from the company's published earnings short report and may be subject to subsequent revision.