China drags, North America and Asia grow
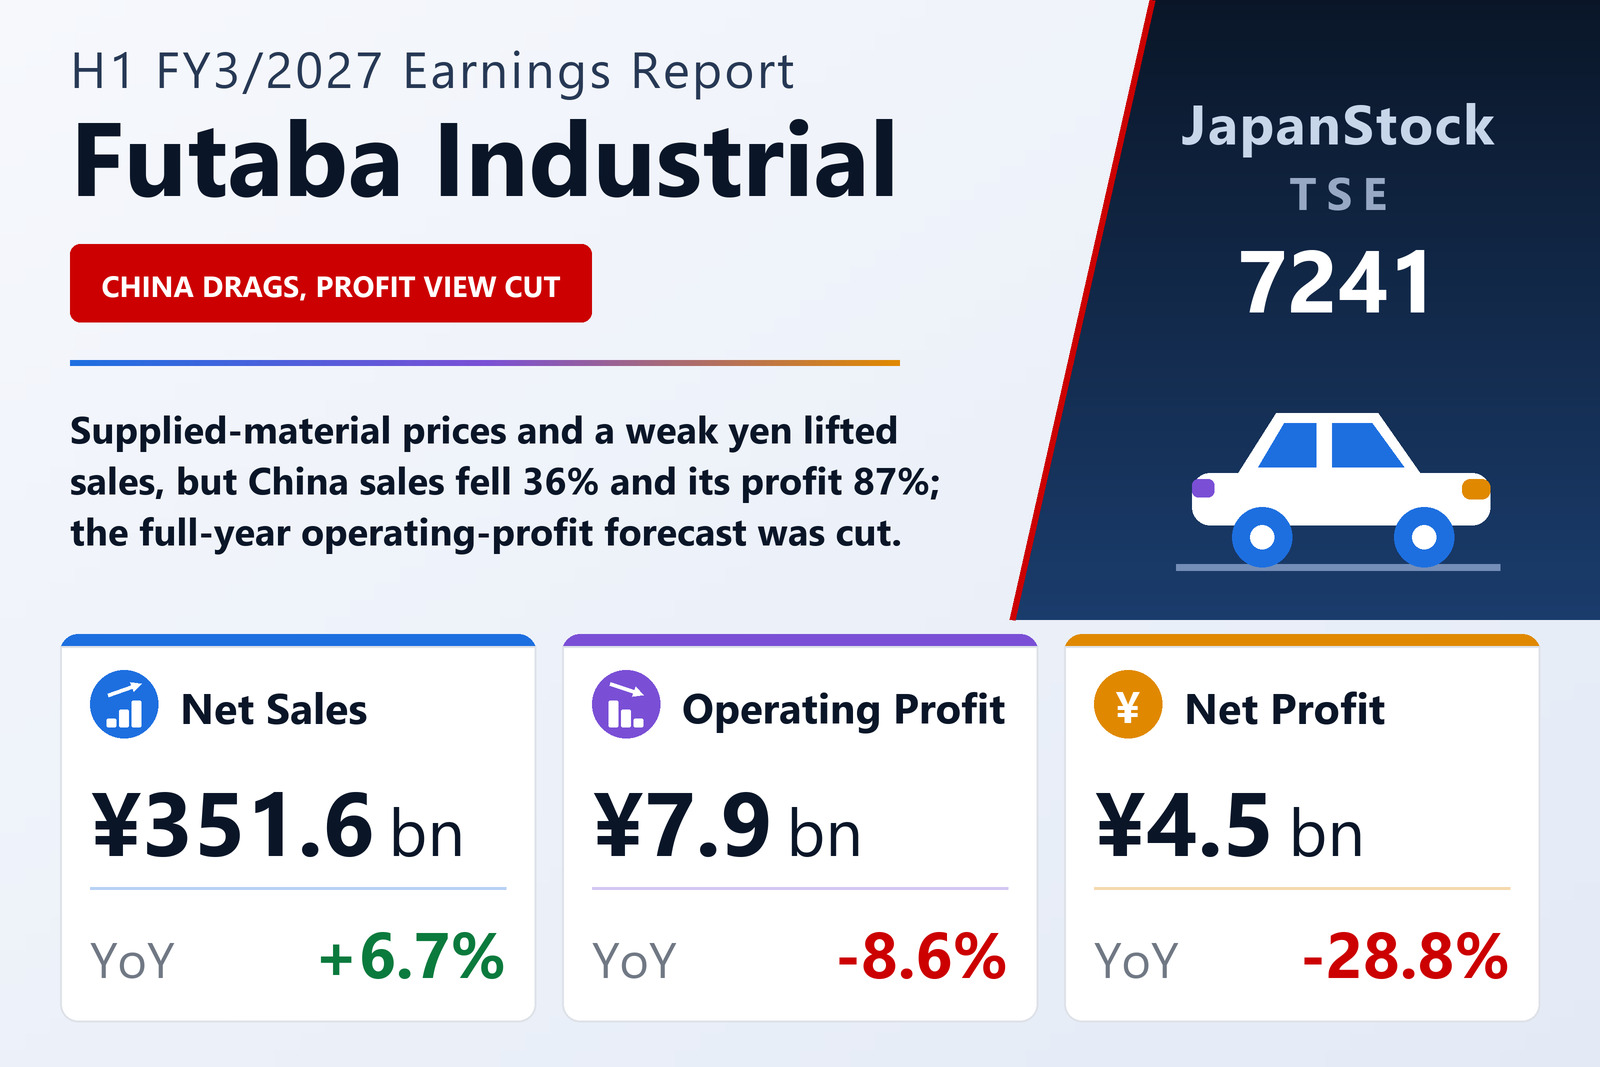
Futaba Industrial Co., Ltd. (TSE: 7241) reported consolidated results for the first half of FY3/2027, April 1 to September 30, 2026, on October 28, 2026 under Japanese GAAP. Supplied materials are catalysts and other parts that customers supply at a charge and that pass through the selling price without affecting profit; stripping out those and currency effects, the company puts underlying sales down ¥3.9 billion, or 1.8%. Japan grew sales 3.4% to ¥162,833 million and profit 9.7% to ¥3,496 million on higher customer vehicle output; North America grew sales 10.9% to ¥98,074 million and profit 9.7% to ¥3,208 million on efficiency gains and price pass-through. China was the weak spot, with sales down 35.7% to ¥21,163 million and profit down 87.5% to ¥195 million. Europe grew sales 11.8% but profit fell to ¥55 million, while Asia grew sales 63.7% to ¥42,011 million and profit to ¥987 million from ¥302 million.
Costs and depreciation outweigh pass-through
Price pass-through and efficiency gains added to profit, but higher material, labour and overhead costs, a ¥2.1 billion rise in depreciation to ¥12,874 million and lower parts-business sales outweighed them. The dollar averaged ¥159.4 against ¥146.0. Toyota group companies accounted for 77.3% of sales including supplied materials. Total assets fell 0.6% to ¥332,188 million on lower cash, net assets rose 0.9% to ¥147,204 million and the equity ratio improved to 42.3% from 41.5%. Earnings per share were ¥50.92 against ¥71.40.
Profit forecast cut, dividend plan unchanged
Futaba revised its FY3/2027 forecast: net sales to ¥713,000 million (+5.2%) from ¥690,000 million, but operating profit to ¥18,000 million (−3.8%) from ¥19,000 million, ordinary profit to ¥17,000 million (−18.4%) from ¥19,000 million and net profit to ¥12,000 million (−25.1%) from ¥14,000 million, for earnings per share of ¥134.36. China's full-year operating-profit forecast was cut to zero. The interim dividend was raised to ¥22 from ¥20 and the planned year-end dividend is ¥23, for an annual ¥45 against ¥43.
| Metric | H1 FY3/2027 | H1 FY3/2026 | Change |
|---|---|---|---|
| Net sales (¥ million) | 351,559 | 329,478 | +6.7% |
| Net sales excl. supplied materials (¥ million) | 224,093 | 218,926 | +2.4% |
| Operating profit (¥ million) | 7,867 | 8,607 | -8.6% |
| Ordinary profit (¥ million) | 6,974 | 8,786 | -20.6% |
| Net profit attrib. to owners of parent (¥ million) | 4,547 | 6,390 | -28.8% |
| Comprehensive income (¥ million) | 3,744 | 8,498 | -55.9% |
| EPS (¥) | 50.92 | 71.40 | -28.7% |
| Japan — revenue (¥ million) | 162,833 | 157,543 | +3.4% |
| Japan — segment profit (¥ million) | 3,496 | 3,188 | +9.7% |
| North America — revenue (¥ million) | 98,074 | 88,400 | +10.9% |
| North America — segment profit (¥ million) | 3,208 | 2,925 | +9.7% |
| Europe — revenue (¥ million) | 33,483 | 29,941 | +11.8% |
| Europe — segment profit (¥ million) | 55 | 648 | -91.5% |
| China — revenue (¥ million) | 21,163 | 32,911 | -35.7% |
| China — segment profit (¥ million) | 195 | 1,563 | -87.5% |
| Asia — revenue (¥ million) | 42,011 | 25,668 | +63.7% |
| Asia — segment profit (¥ million) | 987 | 302 | +226.8% |
| Total assets (¥ million) | 332,188 | 334,332 | -0.6% |
| Net assets (¥ million) | 147,204 | 145,851 | +0.9% |
| Equity ratio | 42.3% | 41.5% | +0.8 pt |
| FY3/2027 guidance — revenue (¥ million) | 713,000 | — | +5.2% |
| FY3/2027 guidance — operating profit (¥ million) | 18,000 | — | -3.8% |
| FY3/2027 guidance — ordinary profit (¥ million) | 17,000 | — | -18.4% |
| FY3/2027 guidance — net profit (¥ million) | 12,000 | — | -25.1% |
| Annual dividend per share (¥) | 45.00 | 43.00 | +4.7% |
JapanStockPulse provides informational content only and does not constitute investment advice. Figures are taken from the company's published earnings short report and may be subject to subsequent revision.