Exits and capital gains
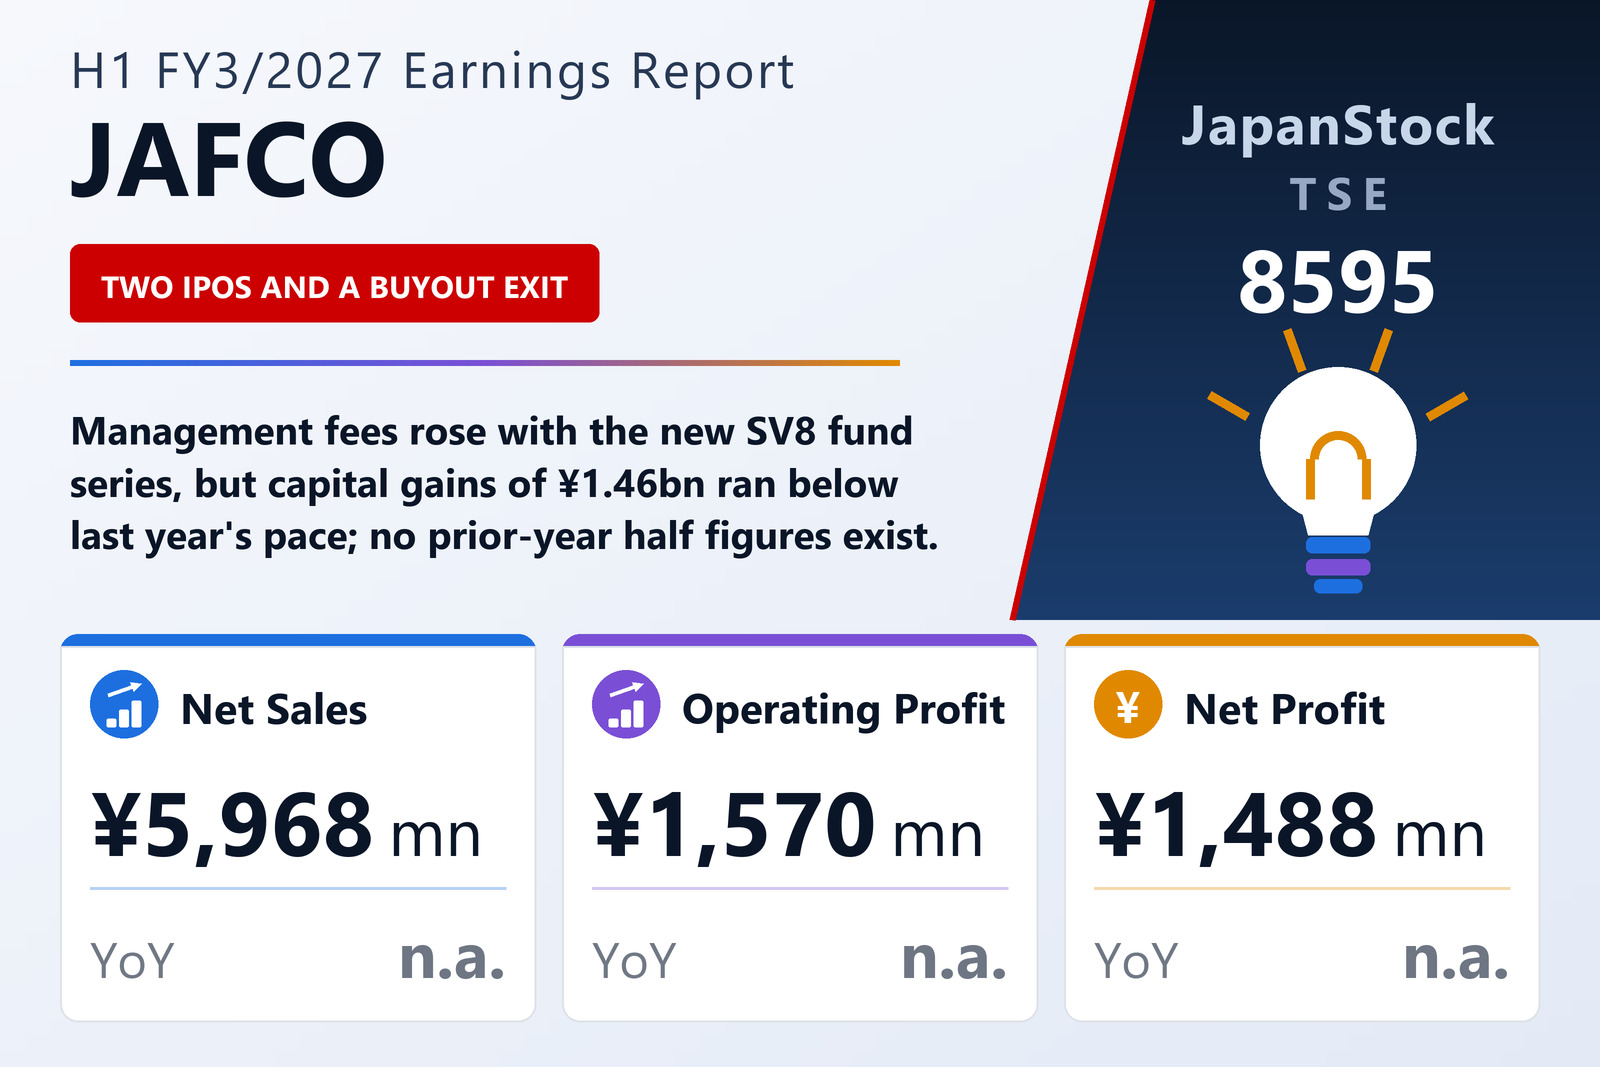
JAFCO Co., Ltd. (TSE: 8595) reported non-consolidated results for the first half of FY3/2027, April 1 to September 30, 2026, on October 28, 2026 under Japanese GAAP. Two venture portfolio companies went public during the half and one buyout investment was exited through a share sale. Sales of operating investment securities were ¥4,006 million against a cost of sales of ¥2,374 million, for capital gains of ¥1,463 million and an investment multiple of 1.58 times; on an annualised basis that is about 31% of the ¥9,467 million earned from domestic investments in the previous full year. Net additions to the reserve for investment losses turned into a small ¥72 million reversal, though the reserve ratio on unlisted holdings rose to 19.9% from 19.3%.
Fees and the balance sheet
Fund management income was ¥1,961 million: management fees of ¥1,859 million rose above last year's annualised level as the SV8 fund series began operating, while success fees fell to ¥101 million on the low level of exits. New listings and higher market values lifted the carrying amount of operating investment securities 4.5% to ¥67,446 million, of which ¥22,891 million is listed. Total assets were ¥159,062 million, net assets ¥134,729 million and the equity ratio 84.7%.
Dividend policy, no forecast
JAFCO paid an interim dividend of ¥66.50 and plans a minimum year-end dividend of ¥66.50, for an annual minimum of ¥133, unchanged from last year. It does not publish earnings forecasts, saying results swing widely with equity and IPO markets. JAFCO sold its Asian unit in October 2025 and its U.S. affiliate in January 2026, and switched to non-consolidated reporting after deconsolidating its last subsidiaries.
| Metric | H1 FY3/2027 | H1 FY3/2026 | Change |
|---|---|---|---|
| Net sales (¥ million) | 5,968 | — | — |
| Capital gains on operating investment securities (¥ million) | 1,463 | — | — |
| Fund management fees (¥ million) | 1,859 | — | — |
| Operating profit (¥ million) | 1,570 | — | — |
| Ordinary profit (¥ million) | 1,498 | — | — |
| Net profit (¥ million) | 1,488 | — | — |
| EPS (¥) | 28.27 | — | — |
| Operating investment securities, carrying amount (¥ million) | 67,446 | 64,562 | +4.5% |
| Total assets (¥ million) | 159,062 | 157,856 | +0.8% |
| Net assets (¥ million) | 134,729 | 134,113 | +0.5% |
| Equity ratio | 84.7% | 85.0% | -0.3 pt |
JapanStockPulse provides informational content only and does not constitute investment advice. Figures are taken from the company's published earnings short report and may be subject to subsequent revision.