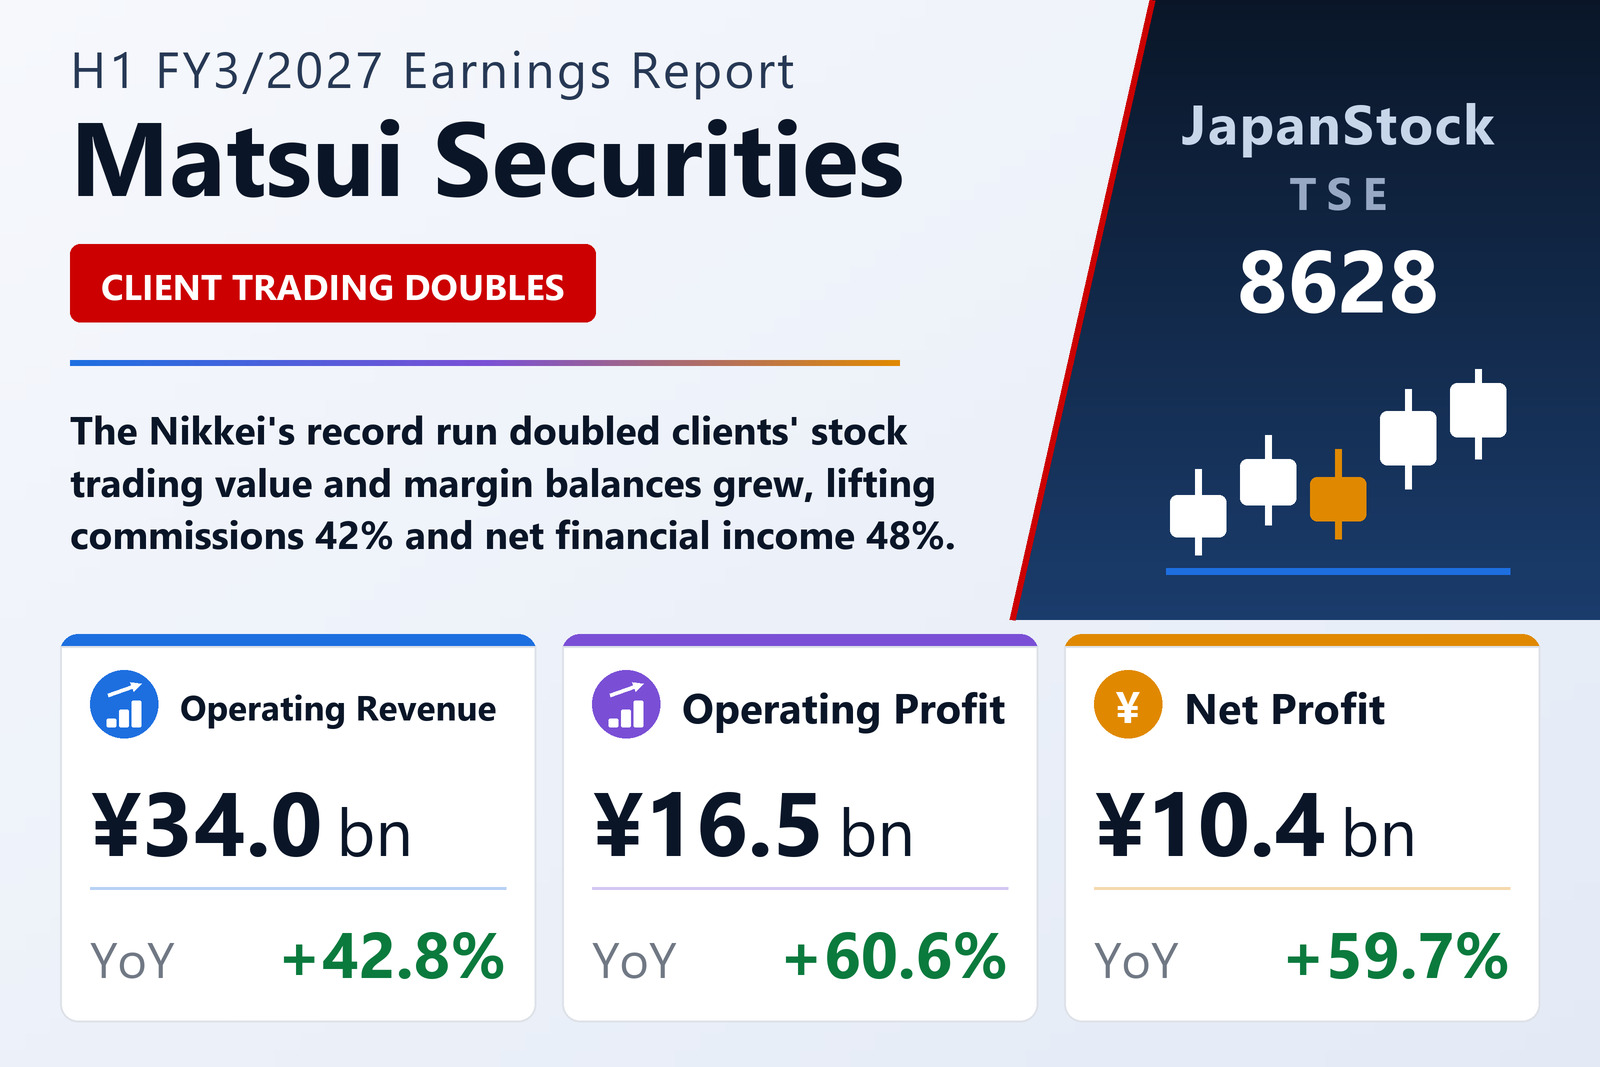
A record market doubles client trading
Matsui Securities Co., Ltd. (TSE: 8628) reported non-consolidated results for the first half of FY3/2027, April 1 to September 30, 2026, on October 28, 2026 under Japanese GAAP. The Nikkei Stock Average opened the period in the 51,000s, closed above 60,000 for the first time in late April and touched an intraday record in the 72,000s on June 22, before ending September in the 66,000s. Stock trading value on the Tokyo and Nagoya exchanges rose 88% and individual investors' brokerage trading value 89%, while Matsui's own clients' stock brokerage trading value rose 100%. Commissions received rose 42.0% to ¥16,109 million, including brokerage commissions up 42.5% to ¥15,421 million, even though a larger share of commission-free day-trading on margin lowered the average rate.
Interest income and costs
Net financial income rose 48.1% to ¥11,735 million as distributions from segregated customer trusts grew and margin-lending income rose with larger margin balances, outweighing higher interest costs. Trading gains, mainly from FX, slipped 1.6% to ¥3,005 million. Selling, general and administrative expenses rose 19.2% to ¥14,374 million on advertising and exchange-related costs. A ¥1,261 million provision to the financial-instruments transaction liability reserve led to an extraordinary loss of ¥1,302 million. The company says its YouTube channel reached 1.08 million subscribers and 200 million total views.
Balance sheet and dividend
Total assets rose 9.0% to ¥1,476,479 million, led by margin loans up 20.3% to ¥509,493 million, and net assets rose 5.6% to ¥86,986 million. Earnings per share were ¥40.50 against ¥25.38. Matsui raised the interim dividend to ¥28 from ¥25; it has not set an annual dividend forecast and, like other brokers whose earnings track the market, publishes no earnings guidance.
| Metric | H1 FY3/2027 | H1 FY3/2026 | Change |
|---|---|---|---|
| Operating revenue (¥ million) | 34,048 | 23,839 | +42.8% |
| Net revenue (¥ million) | 30,858 | 22,323 | +38.2% |
| Operating profit (¥ million) | 16,484 | 10,263 | +60.6% |
| Ordinary profit (¥ million) | 16,528 | 10,152 | +62.8% |
| Net profit (¥ million) | 10,435 | 6,535 | +59.7% |
| EPS (¥) | 40.50 | 25.38 | +59.6% |
| Total assets (¥ million) | 1,476,479 | 1,354,059 | +9.0% |
| Net assets (¥ million) | 86,986 | 82,347 | +5.6% |
| Equity ratio | 5.9% | 6.1% | -0.2 pt |
| Interim dividend per share (¥) | 28.00 | 25.00 | +12.0% |
JapanStockPulse provides informational content only and does not constitute investment advice. Figures are taken from the company's published earnings short report and may be subject to subsequent revision.