Distribution lines up, indoor wiring down
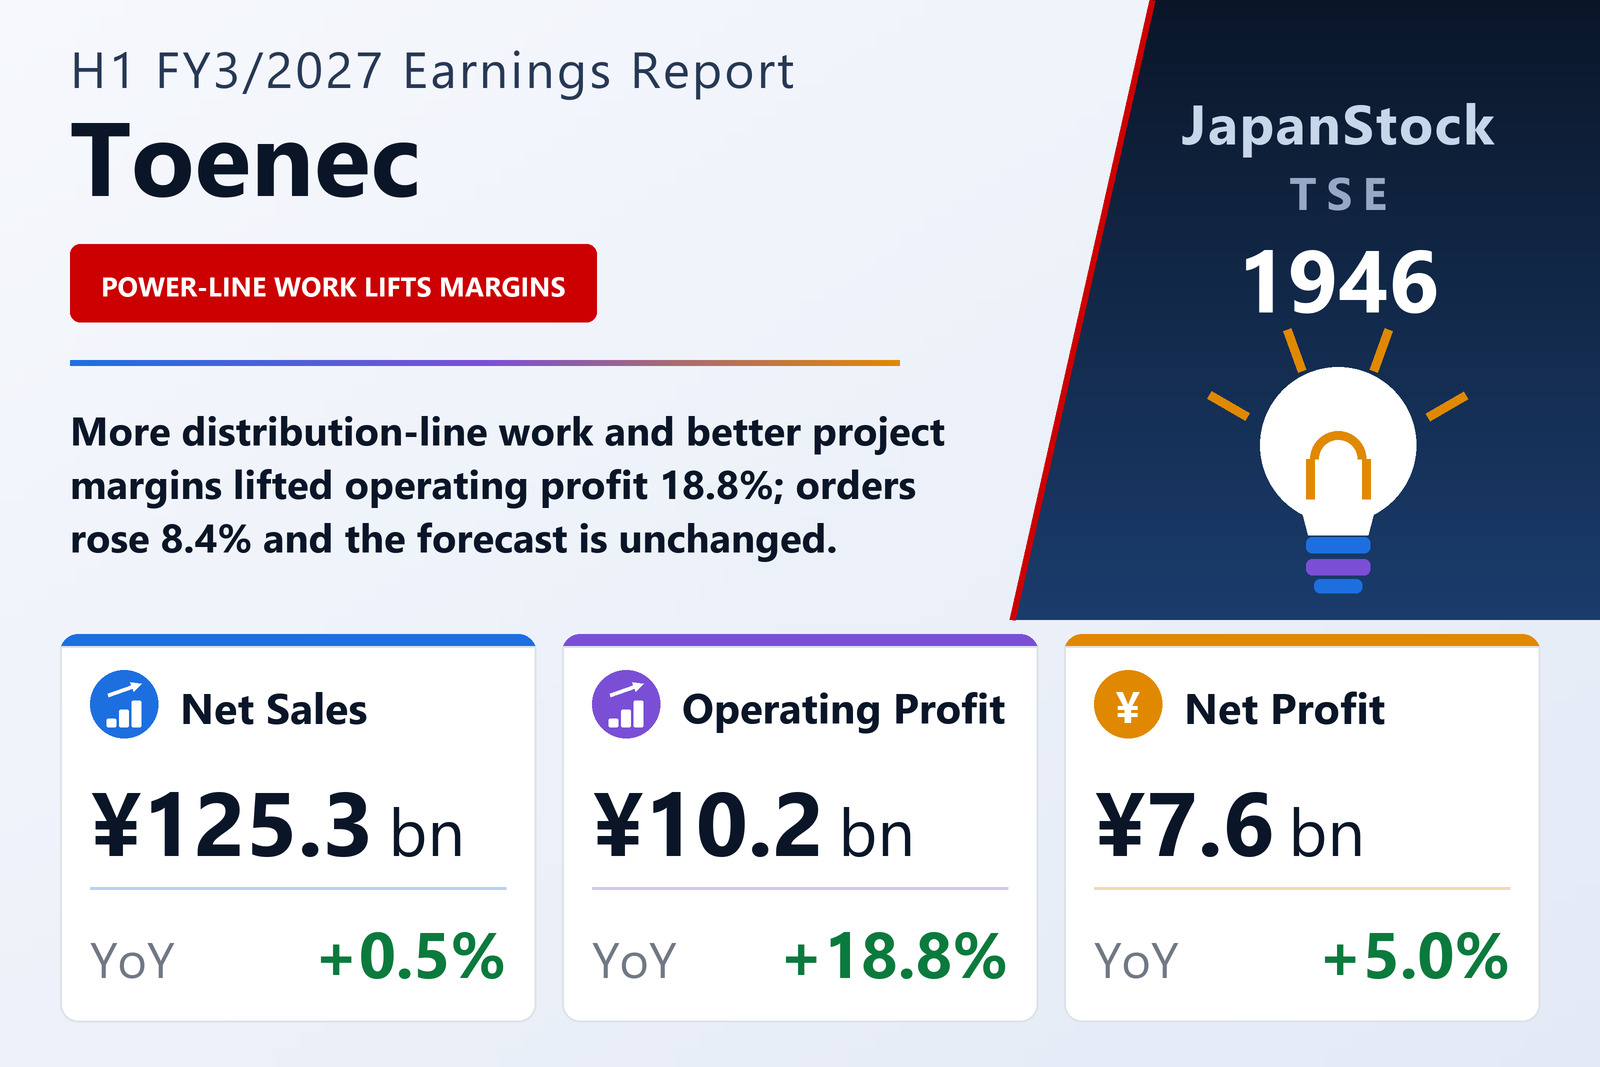
Toenec Corporation (TSE: 1946) reported consolidated results for the first half of FY3/2027, April 1 to September 30, 2026, on October 29, 2026 under Japanese GAAP. Sales of indoor-wiring work fell, but a larger volume of distribution-line work lifted the top line, and better project profitability drove the rise in operating profit. The company booked a settlement of ¥1,053 million as extraordinary income. On a non-consolidated basis, orders rose 8.4% to ¥136,111 million: orders from the Chubu Electric Power group grew 18.2% to ¥52,435 million and those from general customers 3.1% to ¥83,675 million, with distribution-line orders up 18.9% and underground-line orders up 34.8%. Comprehensive income rose 50.7% to ¥9,587 million, and earnings per share were ¥81.03 against ¥77.75.
Balance sheet, forecast and dividend
Total assets fell 7.1% to ¥290,022 million as receivables shrank by ¥13,588 million and cash by ¥10,119 million, while payables fell ¥24,901 million; net assets rose 4.1% to ¥159,501 million and the equity ratio climbed to 55.0% from 49.1%. Operating cash flow was ¥2,626 million against ¥9,154 million a year earlier. Toenec kept its FY3/2027 forecast of net sales of ¥285,000 million (+4.6%), operating profit of ¥24,000 million (+12.0%), ordinary profit of ¥23,500 million (+3.8%) and net profit of ¥18,000 million (+1.1%). It paid an interim dividend of ¥31, up from ¥28, and plans ¥45 at year end for an unchanged annual ¥76.
| Metric | H1 FY3/2027 | H1 FY3/2026 | Change |
|---|---|---|---|
| Net sales (¥ million) | 125,276 | 124,714 | +0.5% |
| Operating profit (¥ million) | 10,178 | 8,566 | +18.8% |
| Ordinary profit (¥ million) | 9,881 | 8,684 | +13.8% |
| Net profit attrib. to owners of parent (¥ million) | 7,573 | 7,216 | +5.0% |
| Comprehensive income (¥ million) | 9,587 | 6,363 | +50.7% |
| EPS (¥) | 81.03 | 77.75 | +4.2% |
| Orders received, non-consolidated (¥ million) | 136,111 | 125,526 | +8.4% |
| Total assets (¥ million) | 290,022 | 312,053 | -7.1% |
| Net assets (¥ million) | 159,501 | 153,170 | +4.1% |
| Equity ratio | 55.0% | 49.1% | +5.9 pt |
| FY3/2027 guidance — revenue (¥ million) | 285,000 | — | +4.6% |
| FY3/2027 guidance — operating profit (¥ million) | 24,000 | — | +12.0% |
| FY3/2027 guidance — ordinary profit (¥ million) | 23,500 | — | +3.8% |
| FY3/2027 guidance — net profit (¥ million) | 18,000 | — | +1.1% |
| Annual dividend per share (¥) | 76.00 | 76.00 | unchanged |
JapanStockPulse provides informational content only and does not constitute investment advice. Figures are taken from the company's published earnings short report and may be subject to subsequent revision.