Price increases weigh on drinks at home
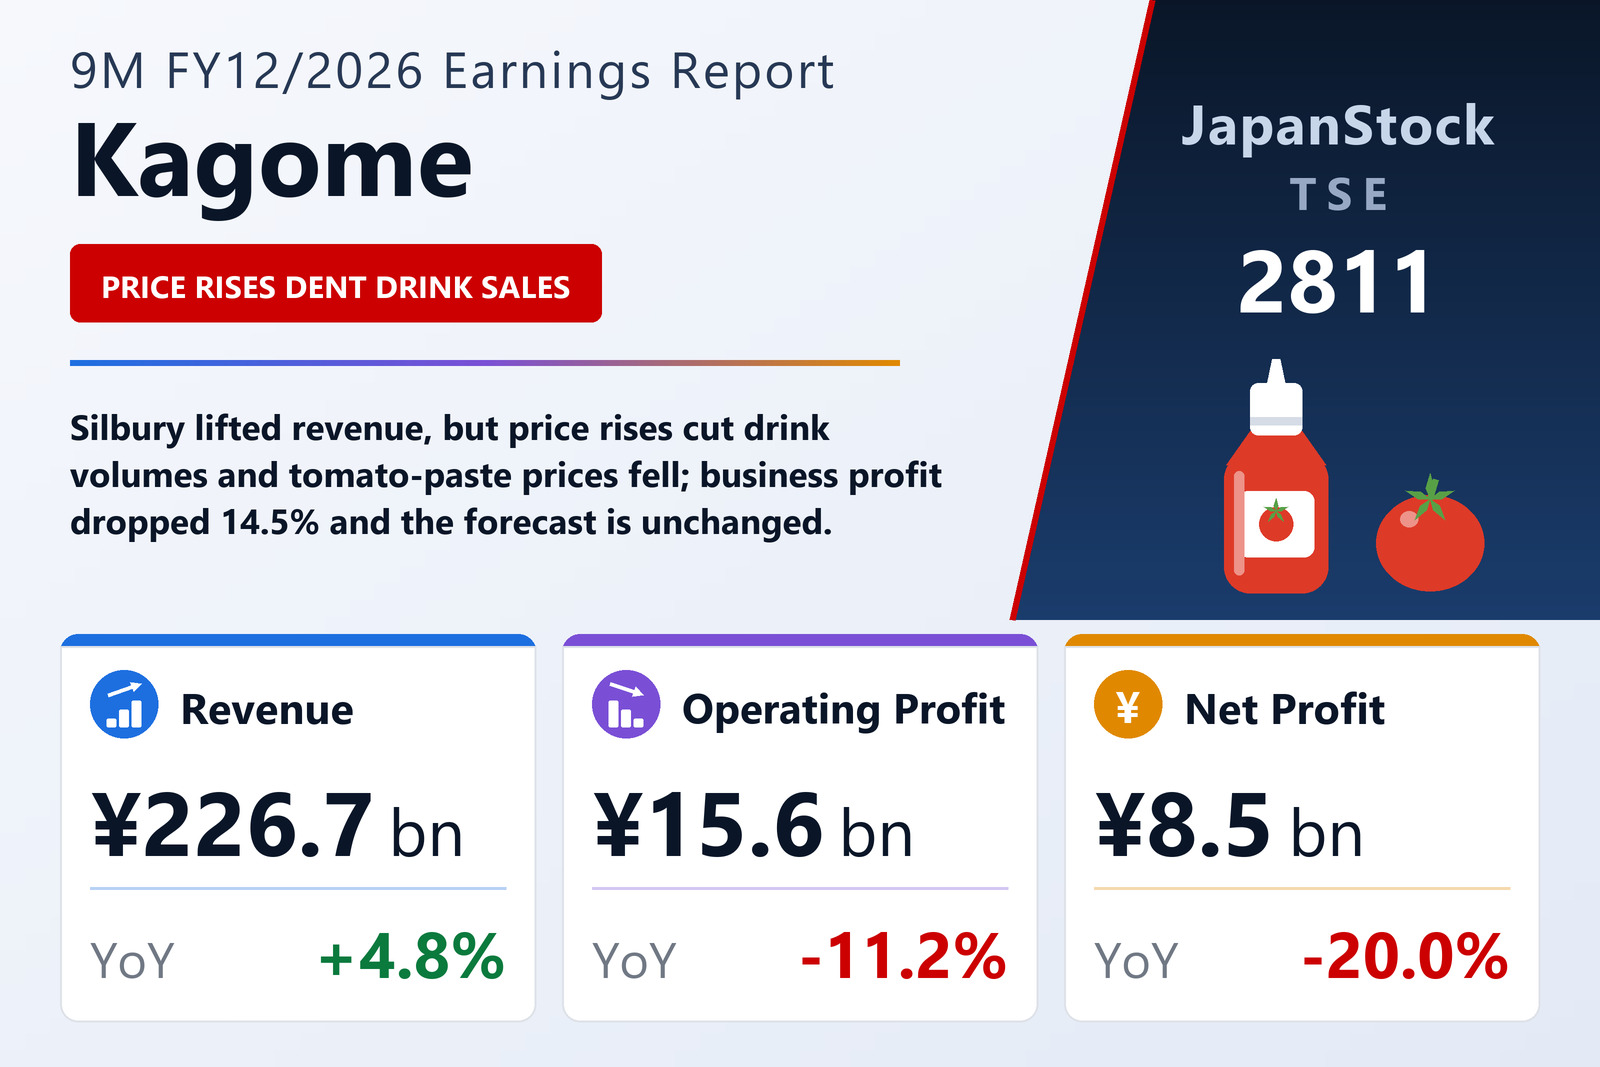
Kagome Co., Ltd. (TSE: 2811) reported consolidated IFRS results for the first nine months of FY12/2026, January 1 to September 30, 2026, on October 29, 2026; it has adopted IFRS 18 early and restated the prior year. With farm raw materials still expensive, Kagome raised shipment prices for some household and food-service drinks. Tomato juice sold well, but volumes of the Yasai Seikatsu 100 range fell after the price rise, and higher advertising and promotion spending followed, so Domestic Processed Food revenue slipped 1.5% to ¥114,413 million and its business profit fell 8.8% to ¥10,265 million. In International, the consolidation of Silbury lifted revenue 14.7% to ¥106,874 million, but lower tomato-paste selling prices in a falling world market and higher manufacturing costs cut business profit 10.6% to ¥6,890 million.
Forecast and dividend unchanged
Total assets were ¥378,608 million against ¥375,820 million at the end of 2025, and the ratio of equity attributable to owners stood at 50.6%. Comprehensive income rose 22.6% to ¥10,326 million, while basic earnings per share were ¥94.46 against ¥116.15. Kagome kept its FY12/2026 forecast of revenue of ¥310,000 million (+5.3%), business profit of ¥19,000 million (−15.1%), operating profit of ¥19,500 million (−12.6%) and profit of ¥10,500 million (−29.1%), with a year-end dividend of ¥58 against ¥48.
| Metric | 9M FY12/2026 | 9M FY12/2025 | Change |
|---|---|---|---|
| Revenue (¥ million) | 226,666 | 216,309 | +4.8% |
| Business profit (¥ million) | 14,806 | 17,322 | -14.5% |
| Operating profit (¥ million) | 15,594 | 17,554 | -11.2% |
| Net profit attrib. to owners of parent (¥ million) | 8,548 | 10,681 | -20.0% |
| Comprehensive income (¥ million) | 10,326 | 8,422 | +22.6% |
| EPS (¥) | 94.46 | 116.15 | -18.7% |
| Domestic Processed Food — revenue (¥ million) | 114,413 | 116,104 | -1.5% |
| Domestic Processed Food — business profit (¥ million) | 10,265 | 11,258 | -8.8% |
| International — revenue (¥ million) | 106,874 | 93,156 | +14.7% |
| International — business profit (¥ million) | 6,890 | 7,707 | -10.6% |
| Total assets (¥ million) | 378,608 | 375,820 | +0.7% |
| Equity attrib. to owners of parent (¥ million) | 191,460 | 190,559 | +0.5% |
| Equity ratio | 50.6% | 50.7% | -0.1 pt |
| FY12/2026 guidance — revenue (¥ million) | 310,000 | — | +5.3% |
| FY12/2026 guidance — business profit (¥ million) | 19,000 | — | -15.1% |
| FY12/2026 guidance — operating profit (¥ million) | 19,500 | — | -12.6% |
| FY12/2026 guidance — net profit (¥ million) | 10,500 | — | -29.1% |
| Annual dividend per share (¥) | 58.00 | 48.00 | +20.8% |
JapanStockPulse provides informational content only and does not constitute investment advice. Figures are taken from the company's published earnings short report and may be subject to subsequent revision.