Growth outside ZOZOTOWN runs faster
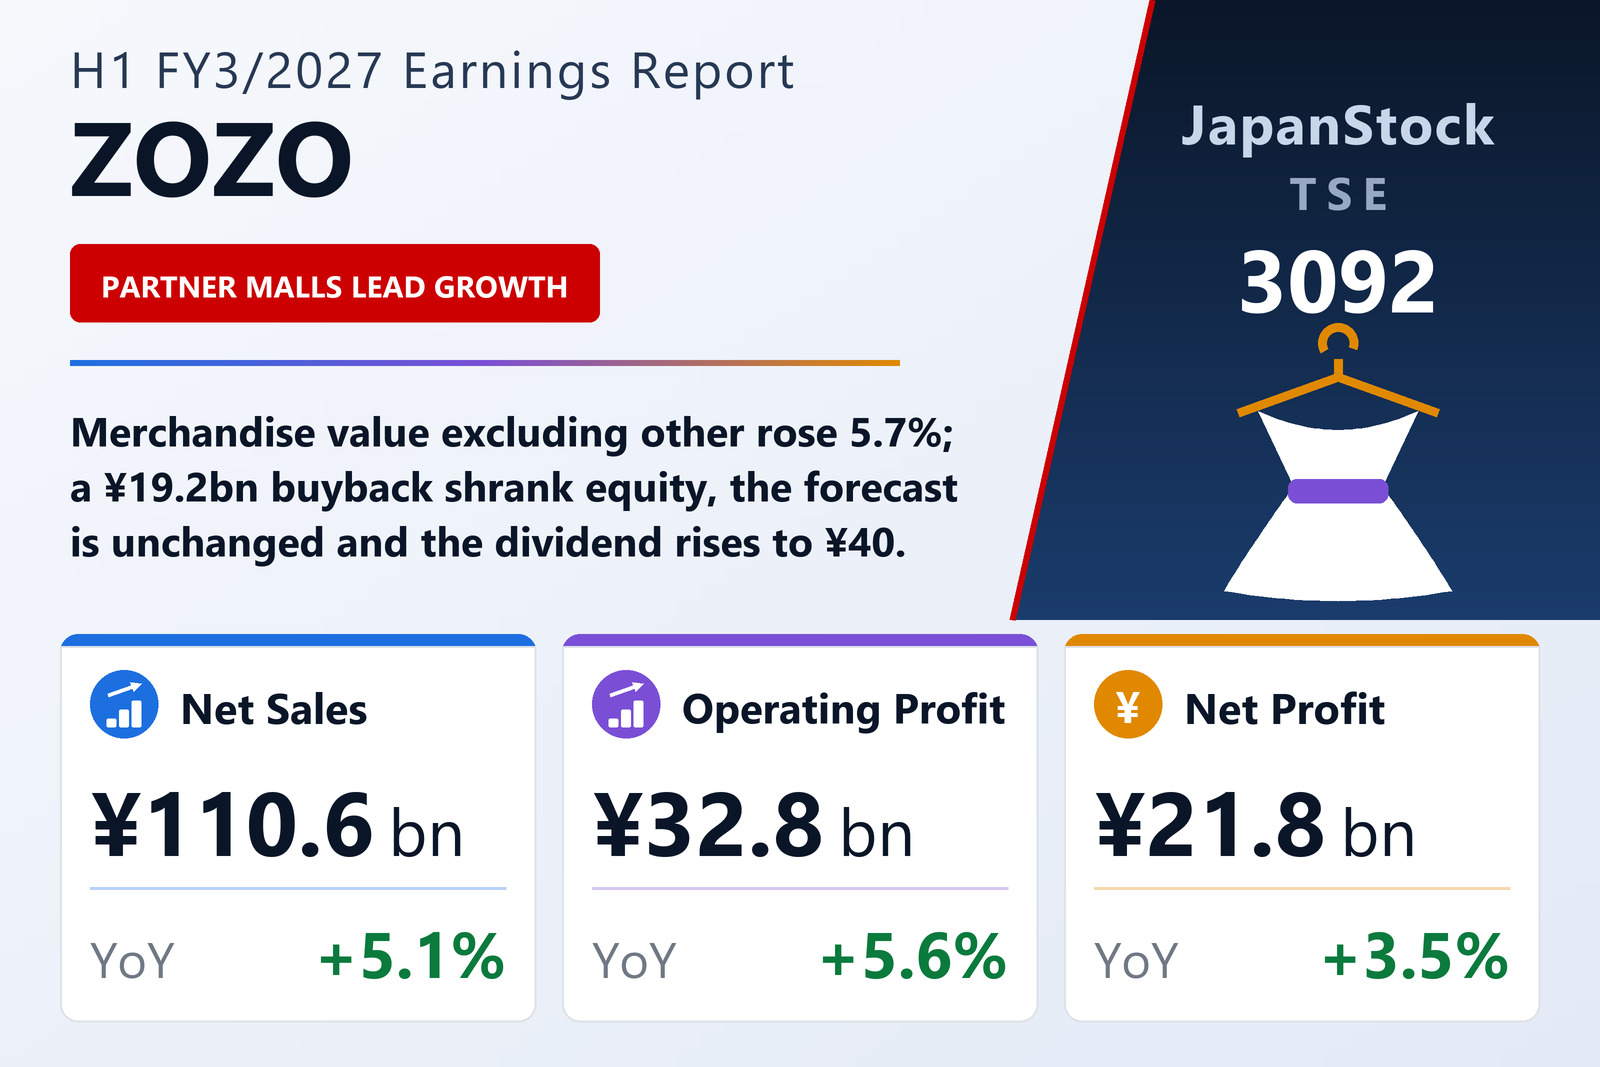
ZOZO, Inc. (TSE: 3092) reported consolidated results for the first half of FY3/2027, April 1 to September 30, 2026, on October 29, 2026 under Japanese GAAP. ZOZOTOWN's gross merchandise value grew 4.4% to ¥245,886 million, supported by TV and web advertising around its ZOZOWEEK sale events and the summer sale, and by an AI styling account on LINE launched in April. Sales through LINE Yahoo commerce, which combines Yahoo! Shopping and Yahoo! Auctions, grew 11.7% to ¥38,469 million, and the fashion platform Lyst grew 16.0% to ¥21,618 million. Total merchandise value including other items fell 1.0% to ¥309,433 million only because a Yahoo! Shopping store category stopped being counted from the end of September 2025. ZOZO also consolidated High Link, operator of the fragrance platform Colaria, from May. Because more of the mix came from the lower-commission Lyst and from discounts and points at ZOZOTOWN, the gross margin on merchandise value slipped 0.4 points to 33.2%, while selling and administrative costs rose only 3.8% to ¥69,930 million as delivery terms improved.
Buyback shrinks the balance sheet
Total assets fell 11.8% to ¥174,892 million and net assets 13.7% to ¥92,112 million, as ZOZO bought back ¥19,165 million of its own shares under a June board resolution and paid ¥17,684 million in dividends; the equity ratio was 52.7% against 53.9%. ZOZO kept its FY3/2027 forecast of net sales of ¥241,900 million (+5.9%), operating profit of ¥74,400 million (+7.3%), adjusted EBITA of ¥77,900 million (+7.2%) and net profit of ¥49,700 million (+3.7%). It raised the interim dividend to ¥20 from ¥19 and plans ¥20 at year end, an annual ¥40 against ¥39.
| Metric | H1 FY3/2027 | H1 FY3/2026 | Change |
|---|---|---|---|
| Gross merchandise value, excl. other (¥ million) | 309,290 | 292,687 | +5.7% |
| Net sales (¥ million) | 110,642 | 105,249 | +5.1% |
| Gross profit (¥ million) | 102,756 | 98,448 | +4.4% |
| Operating profit (¥ million) | 32,825 | 31,074 | +5.6% |
| Adjusted EBITA (¥ million) | 34,614 | 32,920 | +5.1% |
| Ordinary profit (¥ million) | 32,871 | 30,826 | +6.6% |
| Net profit attrib. to owners of parent (¥ million) | 21,751 | 21,006 | +3.5% |
| Comprehensive income (¥ million) | 21,330 | 22,128 | -3.6% |
| EPS (¥) | 24.74 | 23.68 | +4.5% |
| Total assets (¥ million) | 174,892 | 198,260 | -11.8% |
| Net assets (¥ million) | 92,112 | 106,789 | -13.7% |
| Equity ratio | 52.7% | 53.9% | -1.2 pt |
| FY3/2027 guidance — revenue (¥ million) | 241,900 | — | +5.9% |
| FY3/2027 guidance — operating profit (¥ million) | 74,400 | — | +7.3% |
| FY3/2027 guidance — ordinary profit (¥ million) | 74,400 | — | +7.4% |
| FY3/2027 guidance — net profit (¥ million) | 49,700 | — | +3.7% |
| Annual dividend per share (¥) | 40.00 | 39.00 | +2.6% |
JapanStockPulse provides informational content only and does not constitute investment advice. Figures are taken from the company's published earnings short report and may be subject to subsequent revision.